

6 Heat Vulnerability Index Development and Application in Medan City, Indonesia
99
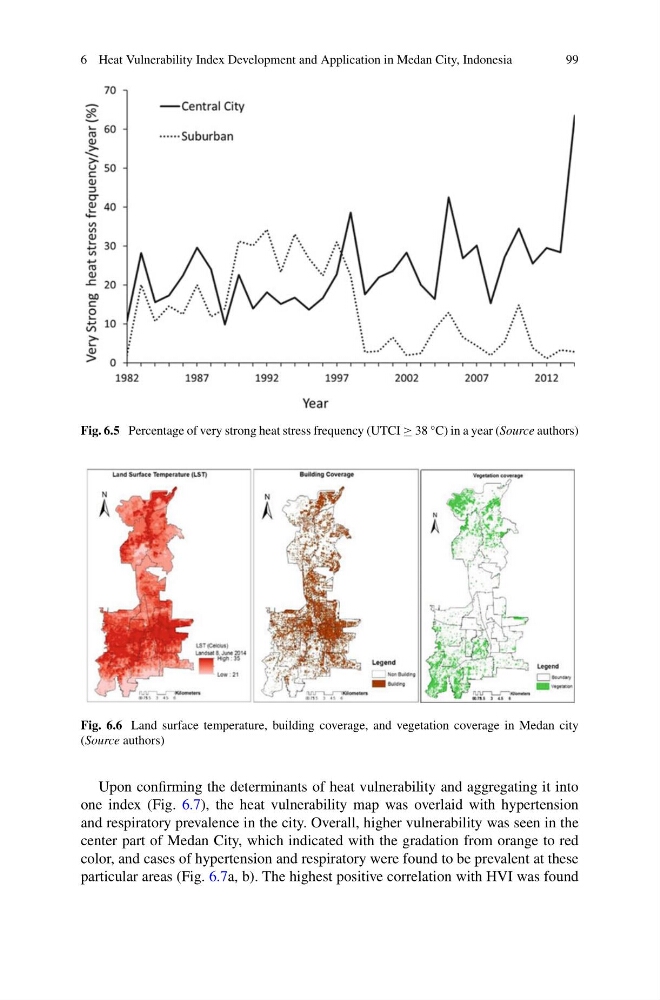
Fig. 6.5 Percentage of very strong heat stress frequency (UTCI ≥ 38 °C) in a year (Source authors)
Fig. 6.6 Land surface temperature, building coverage, and vegetation coverage in Medan city
(Source authors)
Upon confirming the determinants of heat vulnerability and aggregating it into
one index (Fig. 6.7), the heat vulnerability map was overlaid with hypertension
and respiratory prevalence in the city. Overall, higher vulnerability was seen in the
center part of Medan City, which indicated with the gradation from orange to red
color, and cases of hypertension and respiratory were found to be prevalent at these
particular areas (Fig. 6.7a, b). The highest positive correlation with HVI was found
99
Fig. 6.5 Percentage of very strong heat stress frequency (UTCI ≥ 38 °C) in a year (Source authors)
Fig. 6.6 Land surface temperature, building coverage, and vegetation coverage in Medan city
(Source authors)
Upon confirming the determinants of heat vulnerability and aggregating it into
one index (Fig. 6.7), the heat vulnerability map was overlaid with hypertension
and respiratory prevalence in the city. Overall, higher vulnerability was seen in the
center part of Medan City, which indicated with the gradation from orange to red
color, and cases of hypertension and respiratory were found to be prevalent at these
particular areas (Fig. 6.7a, b). The highest positive correlation with HVI was found