

low incomes (Lenzen and Murray 2001, p 244, Fig. 1) because the production of
necessities (such as food and energy) is more land-disturbing than that of luxuries
(such as recreation and financial services). In addition, household expenditure can be
held as a better proxy for land use than income because not earning money and
spending it exerts environmental pressure. Furthermore, the Ecological Footprint is
lower in larger households due to the effects of sharing.
How does the Ecological Footprint account for reuse, recycling, and shared
things? It only seems to entail the impact of reduced (or not) consumption. In
Portugal, for example, Galli et al. (2020) found Almada to have the highest per
person Footprint in 2016 likely due to its proximity to Lisbon, as the capital city and
region in Portugal with the highest incomes, affecting the spending power of
residents (Almada had the highest purchasing power attributable to tourism). Similarly, van den Bergh and Verbruggen (1999) considered changing income to have
an indirect effect on consumption through changes in spending.
5.3 Farmers’ Surveys
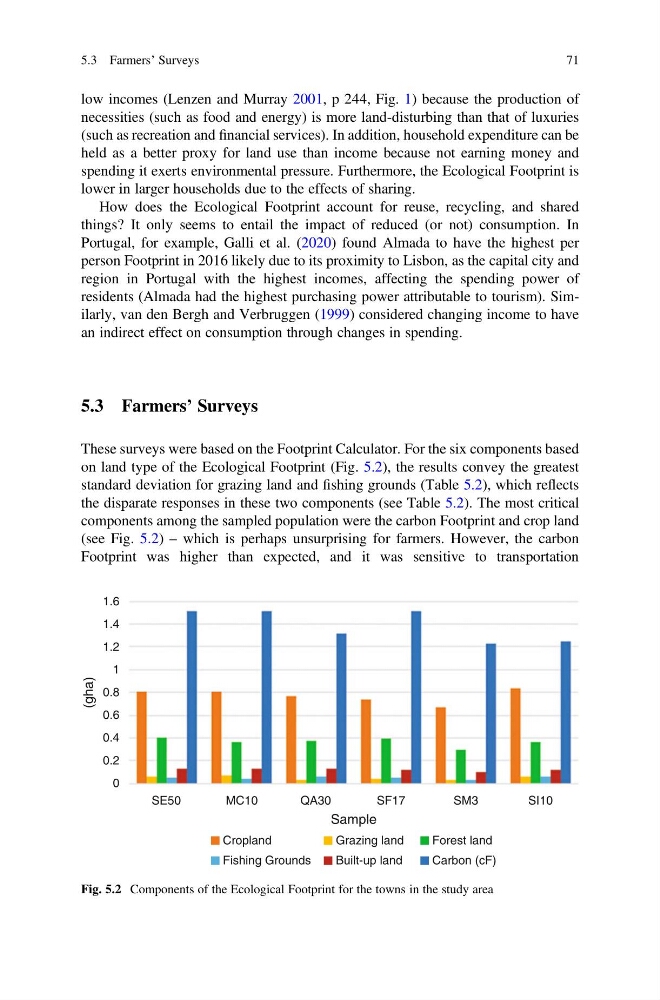
These surveys were based on the Footprint Calculator. For the six components based
on land type of the Ecological Footprint (Fig. 5.2), the results convey the greatest
standard deviation for grazing land and fishing grounds (Table 5.2), which reflects
the disparate responses in these two components (see Table 5.2). The most critical
components among the sampled population were the carbon Footprint and crop land
(see Fig. 5.2) – which is perhaps unsurprising for farmers. However, the carbon
Footprint was higher than expected, and it was sensitive to transportation
Cropland
Fishing Grounds
Grazing land
Built-up land
Forest land
Carbon (cF)
1.6
1.4
1.2
0.8
0.6
0.4
0.2
(gha)
1
0
SE50
MC10
QA30
SF17
SI10
SM3
Sample
Fig. 5.2 Components of the Ecological Footprint for the towns in the study area
5.3 Farmers’ Surveys
71
necessities (such as food and energy) is more land-disturbing than that of luxuries
(such as recreation and financial services). In addition, household expenditure can be
held as a better proxy for land use than income because not earning money and
spending it exerts environmental pressure. Furthermore, the Ecological Footprint is
lower in larger households due to the effects of sharing.
How does the Ecological Footprint account for reuse, recycling, and shared
things? It only seems to entail the impact of reduced (or not) consumption. In
Portugal, for example, Galli et al. (2020) found Almada to have the highest per
person Footprint in 2016 likely due to its proximity to Lisbon, as the capital city and
region in Portugal with the highest incomes, affecting the spending power of
residents (Almada had the highest purchasing power attributable to tourism). Similarly, van den Bergh and Verbruggen (1999) considered changing income to have
an indirect effect on consumption through changes in spending.
5.3 Farmers’ Surveys
These surveys were based on the Footprint Calculator. For the six components based
on land type of the Ecological Footprint (Fig. 5.2), the results convey the greatest
standard deviation for grazing land and fishing grounds (Table 5.2), which reflects
the disparate responses in these two components (see Table 5.2). The most critical
components among the sampled population were the carbon Footprint and crop land
(see Fig. 5.2) – which is perhaps unsurprising for farmers. However, the carbon
Footprint was higher than expected, and it was sensitive to transportation
Cropland
Fishing Grounds
Grazing land
Built-up land
Forest land
Carbon (cF)
1.6
1.4
1.2
0.8
0.6
0.4
0.2
(gha)
1
0
SE50
MC10
QA30
SF17
SI10
SM3
Sample
Fig. 5.2 Components of the Ecological Footprint for the towns in the study area
5.3 Farmers’ Surveys
71