

between countries, using inputs from the National Footprint Accounts more broadly
than country level. Consequently, it is necessary to adopt an integrated
sociobiophysical approach, based on social-ecological systems – which, according
to Haberl et al. (2004), have overlapping natural (biophysical) and cultural (symbolic) spheres of causation in order to calibrate the instrument to its location of use in
interpreting the outputs.
The purpose or overarching aim of this case study was to assess the environmental performance of farmers in the study area in Costa Rica. More specifically, the
objectives of this case study are:
1. To sample as broadly as possible within the study area in the Alexander Skutch
Biological Corridor, Costa Rica.
2. To survey the farmers in the corridor using the Footprint Calculator to assess their
Ecological Footprint (consumption only) in terms of food, housing, and
transportation – which are the consumption categories in the Footprint Calculator.
3. To compare the regional findings with national results using the most recent
available National Footprint Accounts.
This will allow the results of the study to inform one of the chief criticisms of the
Ecological Footprint and biocapacity accounting regarding aggregation (see
Chap. 6), as well as help to contextualise the findings for biocapacity at the national
scale. Specifically, by examining a part of the country that is a biological corridor, it
is possible to ascertain a lower boundary for the national results. From this, one can
ask the question: What lessons can be learned from the corridor’s Footprint? This
will be the major contribution of using this case study in Costa Rica’s corridor, in
addition to a critical approach to using the Footprint Calculator.
4.3 Study Area Sampling
There are at least 2000 farmers located in the Alexander Skutch Biological Corridor,
representing some 600 households (Luis Angel Rojas pers. comm 2020). Therefore,
a sample of at least 96 participating farms was needed for an overall representation at
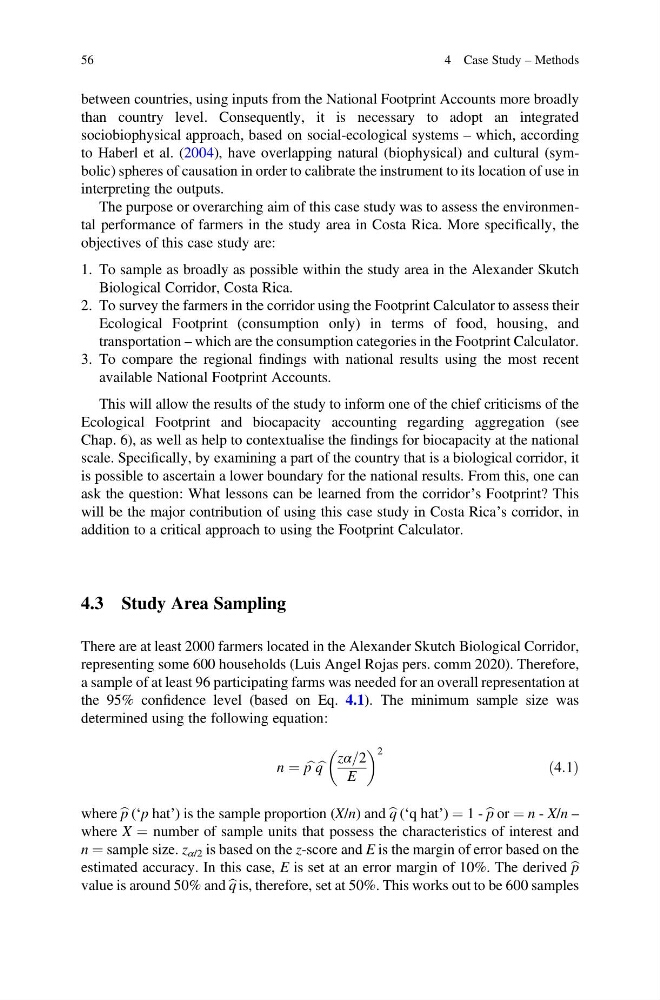
the 95% confidence level (based on Eq. 4.1). The minimum sample size was
determined using the following equation:
n ¼ b
p b
q
zα=2
E
2
ð4:1Þ
where b p (‘p hat’) is the sample proportion (X/n) and b q (‘q hat’) ¼ 1 - b p or ¼ n - X/n –
where X ¼ number of sample units that possess the characteristics of interest and
n ¼ sample size. z α/2 is based on the z-score and E is the margin of error based on the
estimated accuracy. In this case, E is set at an error margin of 10%. The derived b p
value is around 50% and b q is, therefore, set at 50%. This works out to be 600 samples
56
4 Case Study – Methods
than country level. Consequently, it is necessary to adopt an integrated
sociobiophysical approach, based on social-ecological systems – which, according
to Haberl et al. (2004), have overlapping natural (biophysical) and cultural (symbolic) spheres of causation in order to calibrate the instrument to its location of use in
interpreting the outputs.
The purpose or overarching aim of this case study was to assess the environmental performance of farmers in the study area in Costa Rica. More specifically, the
objectives of this case study are:
1. To sample as broadly as possible within the study area in the Alexander Skutch
Biological Corridor, Costa Rica.
2. To survey the farmers in the corridor using the Footprint Calculator to assess their
Ecological Footprint (consumption only) in terms of food, housing, and
transportation – which are the consumption categories in the Footprint Calculator.
3. To compare the regional findings with national results using the most recent
available National Footprint Accounts.
This will allow the results of the study to inform one of the chief criticisms of the
Ecological Footprint and biocapacity accounting regarding aggregation (see
Chap. 6), as well as help to contextualise the findings for biocapacity at the national
scale. Specifically, by examining a part of the country that is a biological corridor, it
is possible to ascertain a lower boundary for the national results. From this, one can
ask the question: What lessons can be learned from the corridor’s Footprint? This
will be the major contribution of using this case study in Costa Rica’s corridor, in
addition to a critical approach to using the Footprint Calculator.
4.3 Study Area Sampling
There are at least 2000 farmers located in the Alexander Skutch Biological Corridor,
representing some 600 households (Luis Angel Rojas pers. comm 2020). Therefore,
a sample of at least 96 participating farms was needed for an overall representation at
the 95% confidence level (based on Eq. 4.1). The minimum sample size was
determined using the following equation:
n ¼ b
p b
q
zα=2
E
2
ð4:1Þ
where b p (‘p hat’) is the sample proportion (X/n) and b q (‘q hat’) ¼ 1 - b p or ¼ n - X/n –
where X ¼ number of sample units that possess the characteristics of interest and
n ¼ sample size. z α/2 is based on the z-score and E is the margin of error based on the
estimated accuracy. In this case, E is set at an error margin of 10%. The derived b p
value is around 50% and b q is, therefore, set at 50%. This works out to be 600 samples
56
4 Case Study – Methods