

means that Earth’s carrying capacity may be closer to 4 billion people for a
population-based estimate (see Fig. 1 in United Nations 2019a, p 5). The implication
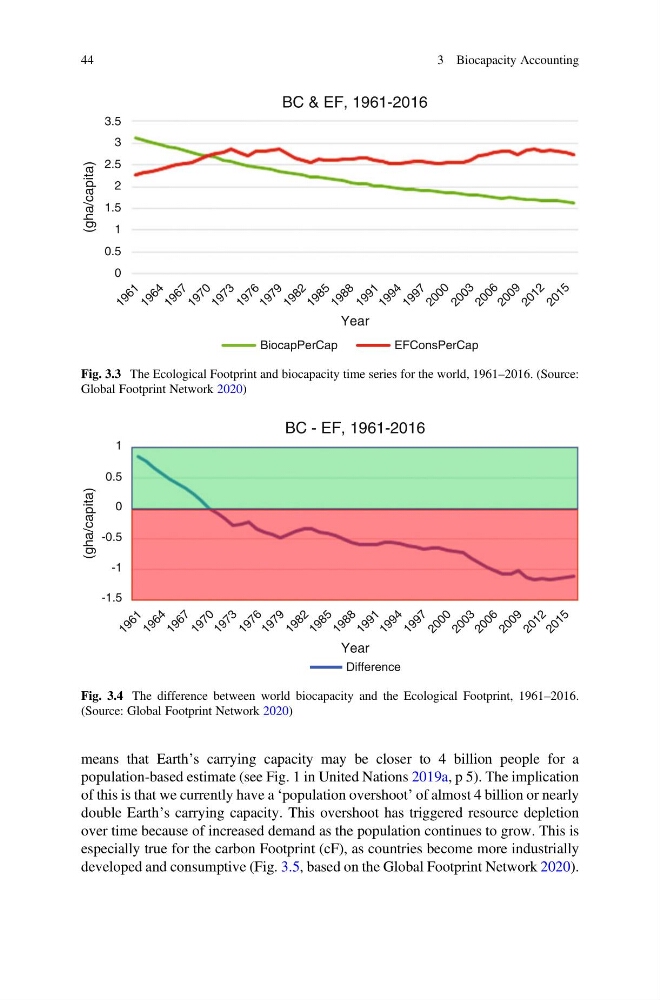
of this is that we currently have a ‘population overshoot’ of almost 4 billion or nearly
double Earth’s carrying capacity. This overshoot has triggered resource depletion
over time because of increased demand as the population continues to grow. This is
especially true for the carbon Footprint (cF), as countries become more industrially
developed and consumptive (Fig. 3.5, based on the Global Footprint Network 2020).
3.5
2.5
1.5
0.5
3
2
1
0
1 9 6 1
1 9 6 4
1 9 6 7
1 9 7 0
1 9 7 3
1 9 7 6
1 9 7 9
1 9 8 2
1 9 8 5
1 9 8 8
1 9 9 1
1 9 9 4
1 9 9 7
2 0 0 0
2 0 0 3
2 0 0 6
2 0 0 9
2 0 1 2
2 0 1 5
BC & EF, 1961-2016
Year
(gha/capita)
BiocapPerCap
EFConsPerCap
Fig. 3.3 The Ecological Footprint and biocapacity time series for the world, 1961–2016. (Source:
Global Footprint Network 2020)
1 9 6 1
1 9 6 4
1 9 6 7
1 9 7 0
1 9 7 3
1 9 7 6
1 9 7 9
1 9 8 2
1 9 8 5
1 9 8 8
1 9 9 1
1 9 9 4
1 9 9 7
2 0 0 0
2 0 0 3
2 0 0 6
2 0 0 9
2 0 1 2
2 0 1 5
Year
BC - EF, 1961-2016
(gha/capita)
0
0.5
-0.5
-1.5
-1
1
Difference
Fig. 3.4 The difference between world biocapacity and the Ecological Footprint, 1961–2016.
(Source: Global Footprint Network 2020)
44
3 Biocapacity Accounting
population-based estimate (see Fig. 1 in United Nations 2019a, p 5). The implication
of this is that we currently have a ‘population overshoot’ of almost 4 billion or nearly
double Earth’s carrying capacity. This overshoot has triggered resource depletion
over time because of increased demand as the population continues to grow. This is
especially true for the carbon Footprint (cF), as countries become more industrially
developed and consumptive (Fig. 3.5, based on the Global Footprint Network 2020).
3.5
2.5
1.5
0.5
3
2
1
0
1 9 6 1
1 9 6 4
1 9 6 7
1 9 7 0
1 9 7 3
1 9 7 6
1 9 7 9
1 9 8 2
1 9 8 5
1 9 8 8
1 9 9 1
1 9 9 4
1 9 9 7
2 0 0 0
2 0 0 3
2 0 0 6
2 0 0 9
2 0 1 2
2 0 1 5
BC & EF, 1961-2016
Year
(gha/capita)
BiocapPerCap
EFConsPerCap
Fig. 3.3 The Ecological Footprint and biocapacity time series for the world, 1961–2016. (Source:
Global Footprint Network 2020)
1 9 6 1
1 9 6 4
1 9 6 7
1 9 7 0
1 9 7 3
1 9 7 6
1 9 7 9
1 9 8 2
1 9 8 5
1 9 8 8
1 9 9 1
1 9 9 4
1 9 9 7
2 0 0 0
2 0 0 3
2 0 0 6
2 0 0 9
2 0 1 2
2 0 1 5
Year
BC - EF, 1961-2016
(gha/capita)
0
0.5
-0.5
-1.5
-1
1
Difference
Fig. 3.4 The difference between world biocapacity and the Ecological Footprint, 1961–2016.
(Source: Global Footprint Network 2020)
44
3 Biocapacity Accounting