

Table 6.5 The distribution of
soil productivity ratings and
suitability classes for selected
crops in the northwestern, Libya
based on (Nwer et al. 2013)
Crop
type
Soil productivity ratings (Area ha)
Excellently
suitable
Highly
suitable
Moderately
suitable
Marginally
suitable
Not
suitable
Barley
–
–
9658.75
97536.53
8326.3
Palm
–
–
9658.75
96559.22
9303.6
Potato
–
–
12320.55
94829.48
8371.55
Olive
–
9658.75
–
16742.08
89120.75
Wheat
–
–
9658.75
97536.53
8326.3
Tomato
–
9658.75
2661.8
95247.45
7953.58
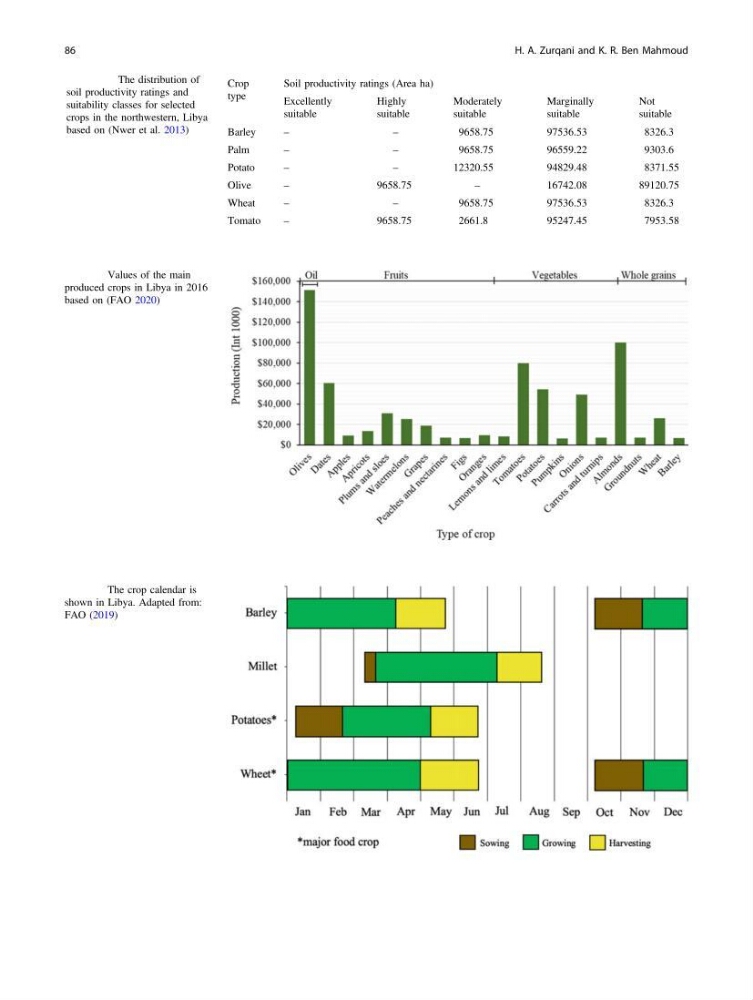
Fig. 6.6 Values of the main
produced crops in Libya in 2016
based on (FAO 2020)
Fig. 6.7 The crop calendar is
shown in Libya. Adapted from:
FAO (2019)
86
H. A. Zurqani and K. R. Ben Mahmoud
soil productivity ratings and
suitability classes for selected
crops in the northwestern, Libya
based on (Nwer et al. 2013)
Crop
type
Soil productivity ratings (Area ha)
Excellently
suitable
Highly
suitable
Moderately
suitable
Marginally
suitable
Not
suitable
Barley
–
–
9658.75
97536.53
8326.3
Palm
–
–
9658.75
96559.22
9303.6
Potato
–
–
12320.55
94829.48
8371.55
Olive
–
9658.75
–
16742.08
89120.75
Wheat
–
–
9658.75
97536.53
8326.3
Tomato
–
9658.75
2661.8
95247.45
7953.58
Fig. 6.6 Values of the main
produced crops in Libya in 2016
based on (FAO 2020)
Fig. 6.7 The crop calendar is
shown in Libya. Adapted from:
FAO (2019)
86
H. A. Zurqani and K. R. Ben Mahmoud