

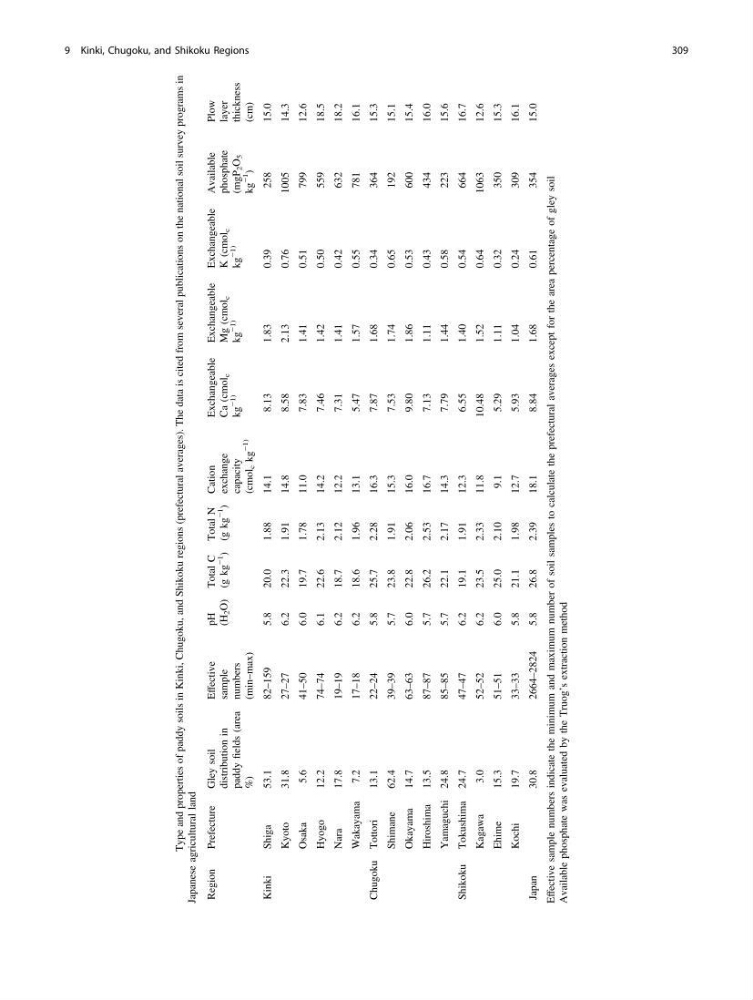
Table 9.4 Type and properties of paddy soils in Kinki, Chugoku, and Shikoku regions (prefectural averages). The data is cited from several publications on the national soil survey programs in
Japanese agricultural land
Region
Prefecture
Gley soil
distribution in
paddy
fields (area
%)
Effective
sample
numbers
(min–max)
pH
(H
2 O)
Total C
(g kg
−1
)
Total N
(g kg
−1
)
Cation
exchange
capacity
(cmol
c kg
−1)
Exchangeable
Ca (cmol
c
kg
−1)
Exchangeable
Mg (cmol
c
kg
−1)
Exchangeable
K (cmol
c
kg
−1)
Available
phosphate
(mgP
2 O
5
kg
−1
)
Plow
layer
thickness
(cm)
Kinki
Shiga
53.1
82–159
5.8
20.0
1.88
14.1
8.13
1.83
0.39
258
15.0
Kyoto
31.8
27–27
6.2
22.3
1.91
14.8
8.58
2.13
0.76
1005
14.3
Osaka
5.6
41–50
6.0
19.7
1.78
11.0
7.83
1.41
0.51
799
12.6
Hyogo
12.2
74–74
6.1
22.6
2.13
14.2
7.46
1.42
0.50
559
18.5
Nara
17.8
19–19
6.2
18.7
2.12
12.2
7.31
1.41
0.42
632
18.2
Wakayama
7.2
17–18
6.2
18.6
1.96
13.1
5.47
1.57
0.55
781
16.1
Chugoku Tottori
13.1
22–24
5.8
25.7
2.28
16.3
7.87
1.68
0.34
364
15.3
Shimane
62.4
39–39
5.7
23.8
1.91
15.3
7.53
1.74
0.65
192
15.1
Okayama
14.7
63–63
6.0
22.8
2.06
16.0
9.80
1.86
0.53
600
15.4
Hiroshima 13.5
87–87
5.7
26.2
2.53
16.7
7.13
1.11
0.43
434
16.0
Yamaguchi 24.8
85–85
5.7
22.1
2.17
14.3
7.79
1.44
0.58
223
15.6
Shikoku Tokushima 24.7
47–47
6.2
19.1
1.91
12.3
6.55
1.40
0.54
664
16.7
Kagawa
3.0
52–52
6.2
23.5
2.33
11.8
10.48
1.52
0.64
1063
12.6
Ehime
15.3
51–51
6.0
25.0
2.10
9.1
5.29
1.11
0.32
350
15.3
Kochi
19.7
33–33
5.8
21.1
1.98
12.7
5.93
1.04
0.24
309
16.1
Japan
30.8
2664–2824
5.8
26.8
2.39
18.1
8.84
1.68
0.61
354
15.0
Effective sample numbers indicate the minimum and maximum number of soil samples to calculate the prefectural averages except for the area percentage of gley soil
Available phosphate was evaluated by the Truog’s extraction method
9 Kinki, Chugoku, and Shikoku Regions
309
Japanese agricultural land
Region
Prefecture
Gley soil
distribution in
paddy
fields (area
%)
Effective
sample
numbers
(min–max)
pH
(H
2 O)
Total C
(g kg
−1
)
Total N
(g kg
−1
)
Cation
exchange
capacity
(cmol
c kg
−1)
Exchangeable
Ca (cmol
c
kg
−1)
Exchangeable
Mg (cmol
c
kg
−1)
Exchangeable
K (cmol
c
kg
−1)
Available
phosphate
(mgP
2 O
5
kg
−1
)
Plow
layer
thickness
(cm)
Kinki
Shiga
53.1
82–159
5.8
20.0
1.88
14.1
8.13
1.83
0.39
258
15.0
Kyoto
31.8
27–27
6.2
22.3
1.91
14.8
8.58
2.13
0.76
1005
14.3
Osaka
5.6
41–50
6.0
19.7
1.78
11.0
7.83
1.41
0.51
799
12.6
Hyogo
12.2
74–74
6.1
22.6
2.13
14.2
7.46
1.42
0.50
559
18.5
Nara
17.8
19–19
6.2
18.7
2.12
12.2
7.31
1.41
0.42
632
18.2
Wakayama
7.2
17–18
6.2
18.6
1.96
13.1
5.47
1.57
0.55
781
16.1
Chugoku Tottori
13.1
22–24
5.8
25.7
2.28
16.3
7.87
1.68
0.34
364
15.3
Shimane
62.4
39–39
5.7
23.8
1.91
15.3
7.53
1.74
0.65
192
15.1
Okayama
14.7
63–63
6.0
22.8
2.06
16.0
9.80
1.86
0.53
600
15.4
Hiroshima 13.5
87–87
5.7
26.2
2.53
16.7
7.13
1.11
0.43
434
16.0
Yamaguchi 24.8
85–85
5.7
22.1
2.17
14.3
7.79
1.44
0.58
223
15.6
Shikoku Tokushima 24.7
47–47
6.2
19.1
1.91
12.3
6.55
1.40
0.54
664
16.7
Kagawa
3.0
52–52
6.2
23.5
2.33
11.8
10.48
1.52
0.64
1063
12.6
Ehime
15.3
51–51
6.0
25.0
2.10
9.1
5.29
1.11
0.32
350
15.3
Kochi
19.7
33–33
5.8
21.1
1.98
12.7
5.93
1.04
0.24
309
16.1
Japan
30.8
2664–2824
5.8
26.8
2.39
18.1
8.84
1.68
0.61
354
15.0
Effective sample numbers indicate the minimum and maximum number of soil samples to calculate the prefectural averages except for the area percentage of gley soil
Available phosphate was evaluated by the Truog’s extraction method
9 Kinki, Chugoku, and Shikoku Regions
309