

Floods in Eastern Subtropical Argentina …
47
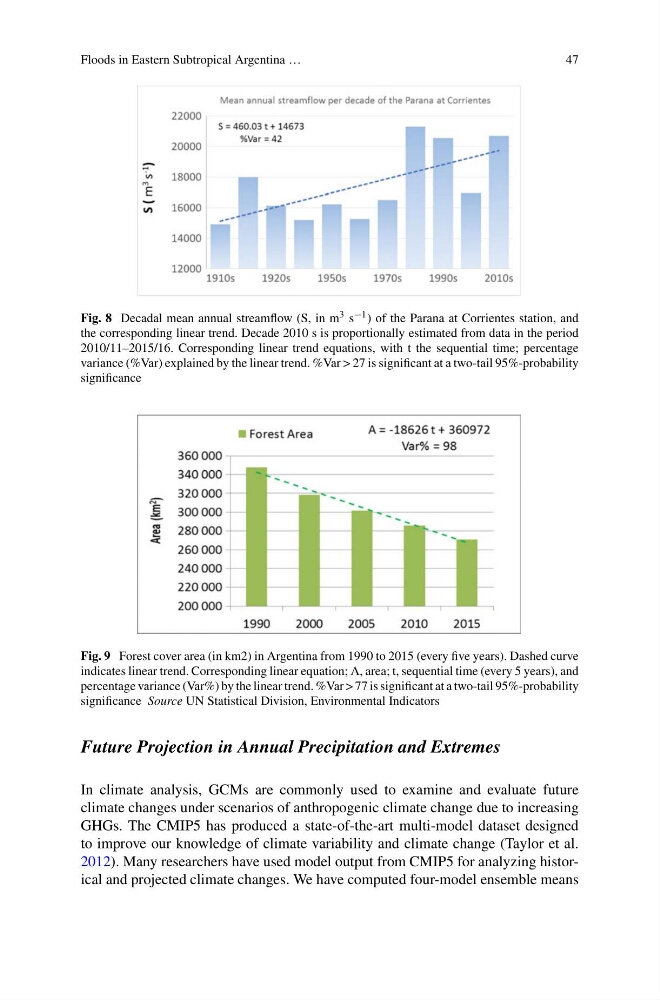
Fig. 8 Decadal mean annual streamflow (S, in m 3 s −1 ) of the Parana at Corrientes station, and
the corresponding linear trend. Decade 2010 s is proportionally estimated from data in the period
2010/11–2015/16. Corresponding linear trend equations, with t the sequential time; percentage
variance (%Var) explained by the linear trend. %Var > 27 is significant at a two-tail 95%-probability
significance
Fig. 9 Forest cover area (in km2) in Argentina from 1990 to 2015 (every five years). Dashed curve
indicates linear trend. Corresponding linear equation; A, area; t, sequential time (every 5 years), and
percentage variance (Var%) by the linear trend. %Var > 77 is significant at a two-tail 95%-probability
significance Source UN Statistical Division, Environmental Indicators
Future Projection in Annual Precipitation and Extremes
In climate analysis, GCMs are commonly used to examine and evaluate future
climate changes under scenarios of anthropogenic climate change due to increasing
GHGs. The CMIP5 has produced a state-of-the-art multi-model dataset designed
to improve our knowledge of climate variability and climate change (Taylor et al.
2012). Many researchers have used model output from CMIP5 for analyzing historical and projected climate changes. We have computed four-model ensemble means
47
Fig. 8 Decadal mean annual streamflow (S, in m 3 s −1 ) of the Parana at Corrientes station, and
the corresponding linear trend. Decade 2010 s is proportionally estimated from data in the period
2010/11–2015/16. Corresponding linear trend equations, with t the sequential time; percentage
variance (%Var) explained by the linear trend. %Var > 27 is significant at a two-tail 95%-probability
significance
Fig. 9 Forest cover area (in km2) in Argentina from 1990 to 2015 (every five years). Dashed curve
indicates linear trend. Corresponding linear equation; A, area; t, sequential time (every 5 years), and
percentage variance (Var%) by the linear trend. %Var > 77 is significant at a two-tail 95%-probability
significance Source UN Statistical Division, Environmental Indicators
Future Projection in Annual Precipitation and Extremes
In climate analysis, GCMs are commonly used to examine and evaluate future
climate changes under scenarios of anthropogenic climate change due to increasing
GHGs. The CMIP5 has produced a state-of-the-art multi-model dataset designed
to improve our knowledge of climate variability and climate change (Taylor et al.
2012). Many researchers have used model output from CMIP5 for analyzing historical and projected climate changes. We have computed four-model ensemble means