

46
E. A. Agosta et al.
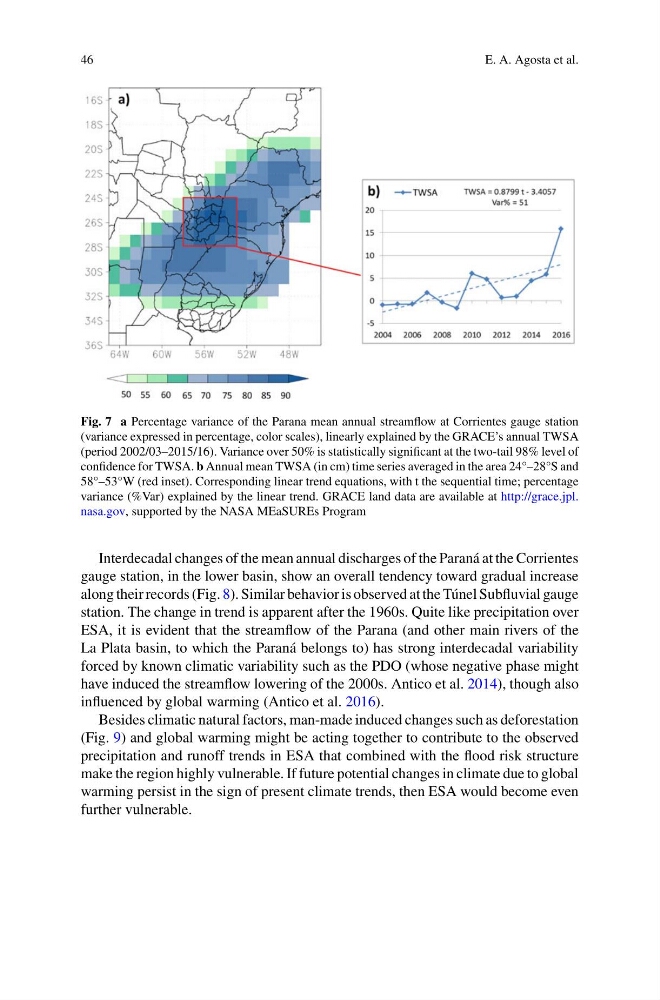
Fig. 7 a Percentage variance of the Parana mean annual streamflow at Corrientes gauge station
(variance expressed in percentage, color scales), linearly explained by the GRACE’s annual TWSA
(period 2002/03–2015/16). Variance over 50% is statistically significant at the two-tail 98% level of
confidence for TWSA. b Annual mean TWSA (in cm) time series averaged in the area 24°–28°S and
58°–53°W (red inset). Corresponding linear trend equations, with t the sequential time; percentage
variance (%Var) explained by the linear trend. GRACE land data are available at http://grace.jpl.
nasa.gov, supported by the NASA MEaSUREs Program
Interdecadal changes of the mean annual discharges of the Paraná at the Corrientes
gauge station, in the lower basin, show an overall tendency toward gradual increase
along their records (Fig. 8). Similar behavior is observed at the Túnel Subfluvial gauge
station. The change in trend is apparent after the 1960s. Quite like precipitation over
ESA, it is evident that the streamflow of the Parana (and other main rivers of the
La Plata basin, to which the Paraná belongs to) has strong interdecadal variability
forced by known climatic variability such as the PDO (whose negative phase might
have induced the streamflow lowering of the 2000s. Antico et al. 2014), though also
influenced by global warming (Antico et al. 2016).
Besides climatic natural factors, man-made induced changes such as deforestation
(Fig. 9) and global warming might be acting together to contribute to the observed
precipitation and runoff trends in ESA that combined with the flood risk structure
make the region highly vulnerable. If future potential changes in climate due to global
warming persist in the sign of present climate trends, then ESA would become even
further vulnerable.
E. A. Agosta et al.
Fig. 7 a Percentage variance of the Parana mean annual streamflow at Corrientes gauge station
(variance expressed in percentage, color scales), linearly explained by the GRACE’s annual TWSA
(period 2002/03–2015/16). Variance over 50% is statistically significant at the two-tail 98% level of
confidence for TWSA. b Annual mean TWSA (in cm) time series averaged in the area 24°–28°S and
58°–53°W (red inset). Corresponding linear trend equations, with t the sequential time; percentage
variance (%Var) explained by the linear trend. GRACE land data are available at http://grace.jpl.
nasa.gov, supported by the NASA MEaSUREs Program
Interdecadal changes of the mean annual discharges of the Paraná at the Corrientes
gauge station, in the lower basin, show an overall tendency toward gradual increase
along their records (Fig. 8). Similar behavior is observed at the Túnel Subfluvial gauge
station. The change in trend is apparent after the 1960s. Quite like precipitation over
ESA, it is evident that the streamflow of the Parana (and other main rivers of the
La Plata basin, to which the Paraná belongs to) has strong interdecadal variability
forced by known climatic variability such as the PDO (whose negative phase might
have induced the streamflow lowering of the 2000s. Antico et al. 2014), though also
influenced by global warming (Antico et al. 2016).
Besides climatic natural factors, man-made induced changes such as deforestation
(Fig. 9) and global warming might be acting together to contribute to the observed
precipitation and runoff trends in ESA that combined with the flood risk structure
make the region highly vulnerable. If future potential changes in climate due to global
warming persist in the sign of present climate trends, then ESA would become even
further vulnerable.