

Natural Resources, Climate Change and Governance
135
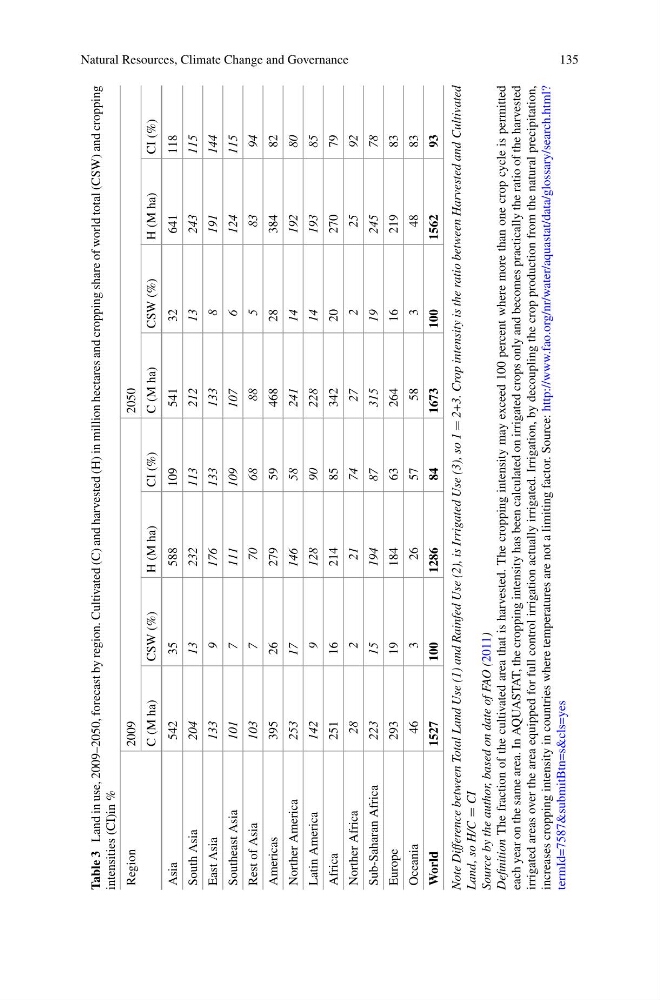
Table 3
Land in use, 2009–2050, forecast by region. Cultivated (C) and harvested (H) in million hectares and cropping share of world total (CSW) and cropping
intensities (CI)in %
Region
2009
2050
C (M ha)
CSW (%)
H (M ha)
CI (%)
C (M ha)
CSW (%)
H (M ha)
CI (%)
Asia
542
35
588
109
541
32
641
118
South Asia
204
13
232
113
212
13
243
115
East Asia
133
9
176
133
133
8
191
144
Southeast Asia
101
7
111
109
107
6
124
115
Rest of Asia
103
7
70
68
88
5
83
94
Americas
395
26
279
59
468
28
384
82
Norther America
253
17
146
58
241
14
192
80
Latin America
142
9
128
90
228
14
193
85
Africa
251
16
214
85
342
20
270
79
Norther Africa
28
2
21
74
27
2
25
92
Sub-Saharan Africa
223
15
194
87
315
19
245
78
Europe
293
19
184
63
264
16
219
83
Oceania
46
3
26
57
58
3
48
83
World
1527
100
1286
84
1673
100
1562
93
Note Difference between Total Land Use (1) and Rainfed Use (2), is Irrigated Use (3), so 1
= 2+3. Crop intensity is the ratio between Harvested and Cultivated
Land, so H/C
= CI
Source by the author, based on date of FAO (2011)
Definition
The fraction of the cultivated area that is harvested. The cropping intensity may exceed 100 percent where more than one crop cycle is permitted
each year on the same area. In AQUASTAT, the cropping intensity has been calculated on irrigated crops only and becomes practically the ratio of the harvested
irrigated areas over the area equipped for full control irrigation actually irrigated. Irrigation, by decoupling the crop production from the natural precipitation,
increases cropping intensity in countries where temperatures are not a limiting factor. Source: http://www.fao.org/nr/water/aquastat/data/glossary/search.html?
termId=7587&submitBtn=s&cls=yes
135
Table 3
Land in use, 2009–2050, forecast by region. Cultivated (C) and harvested (H) in million hectares and cropping share of world total (CSW) and cropping
intensities (CI)in %
Region
2009
2050
C (M ha)
CSW (%)
H (M ha)
CI (%)
C (M ha)
CSW (%)
H (M ha)
CI (%)
Asia
542
35
588
109
541
32
641
118
South Asia
204
13
232
113
212
13
243
115
East Asia
133
9
176
133
133
8
191
144
Southeast Asia
101
7
111
109
107
6
124
115
Rest of Asia
103
7
70
68
88
5
83
94
Americas
395
26
279
59
468
28
384
82
Norther America
253
17
146
58
241
14
192
80
Latin America
142
9
128
90
228
14
193
85
Africa
251
16
214
85
342
20
270
79
Norther Africa
28
2
21
74
27
2
25
92
Sub-Saharan Africa
223
15
194
87
315
19
245
78
Europe
293
19
184
63
264
16
219
83
Oceania
46
3
26
57
58
3
48
83
World
1527
100
1286
84
1673
100
1562
93
Note Difference between Total Land Use (1) and Rainfed Use (2), is Irrigated Use (3), so 1
= 2+3. Crop intensity is the ratio between Harvested and Cultivated
Land, so H/C
= CI
Source by the author, based on date of FAO (2011)
Definition
The fraction of the cultivated area that is harvested. The cropping intensity may exceed 100 percent where more than one crop cycle is permitted
each year on the same area. In AQUASTAT, the cropping intensity has been calculated on irrigated crops only and becomes practically the ratio of the harvested
irrigated areas over the area equipped for full control irrigation actually irrigated. Irrigation, by decoupling the crop production from the natural precipitation,
increases cropping intensity in countries where temperatures are not a limiting factor. Source: http://www.fao.org/nr/water/aquastat/data/glossary/search.html?
termId=7587&submitBtn=s&cls=yes