

4.4.2 Data on Social Costs and Benefits
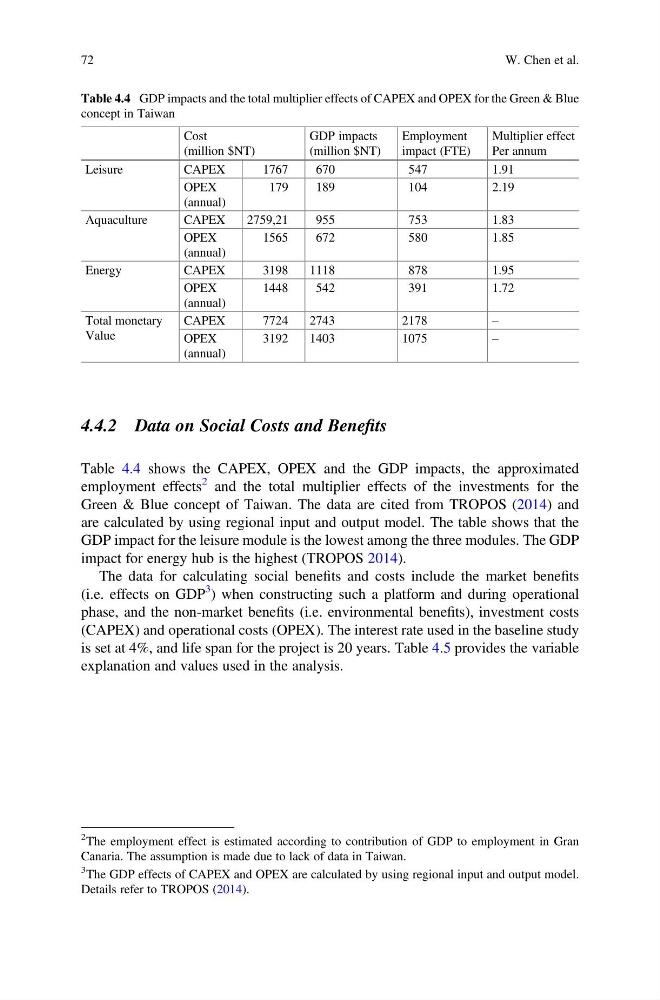
Table 4.4 shows the CAPEX, OPEX and the GDP impacts, the approximated
employment effects
2 and the total multiplier effects of the investments for the
Green & Blue concept of Taiwan. The data are cited from TROPOS (2014) and
are calculated by using regional input and output model. The table shows that the
GDP impact for the leisure module is the lowest among the three modules. The GDP
impact for energy hub is the highest (TROPOS 2014).
The data for calculating social benefits and costs include the market benefits
(i.e. effects on GDP
3 ) when constructing such a platform and during operational
phase, and the non-market benefits (i.e. environmental benefits), investment costs
(CAPEX) and operational costs (OPEX). The interest rate used in the baseline study
is set at 4%, and life span for the project is 20 years. Table 4.5 provides the variable
explanation and values used in the analysis.
Table 4.4 GDP impacts and the total multiplier effects of CAPEX and OPEX for the Green & Blue
concept in Taiwan
Cost
(million $NT)
GDP impacts
(million $NT)
Employment
impact (FTE)
Multiplier effect
Per annum
Leisure
CAPEX
1767
670
547
1.91
OPEX
(annual)
179
189
104
2.19
Aquaculture
CAPEX
2759,21
955
753
1.83
OPEX
(annual)
1565
672
580
1.85
Energy
CAPEX
3198
1118
878
1.95
OPEX
(annual)
1448
542
391
1.72
Total monetary
Value
CAPEX
7724
2743
2178
–
OPEX
(annual)
3192
1403
1075
–
2 The employment effect is estimated according to contribution of GDP to employment in Gran
Canaria. The assumption is made due to lack of data in Taiwan.
3 The GDP effects of CAPEX and OPEX are calculated by using regional input and output model.
Details refer to TROPOS (2014).
72
W. Chen et al.
Table 4.4 shows the CAPEX, OPEX and the GDP impacts, the approximated
employment effects
2 and the total multiplier effects of the investments for the
Green & Blue concept of Taiwan. The data are cited from TROPOS (2014) and
are calculated by using regional input and output model. The table shows that the
GDP impact for the leisure module is the lowest among the three modules. The GDP
impact for energy hub is the highest (TROPOS 2014).
The data for calculating social benefits and costs include the market benefits
(i.e. effects on GDP
3 ) when constructing such a platform and during operational
phase, and the non-market benefits (i.e. environmental benefits), investment costs
(CAPEX) and operational costs (OPEX). The interest rate used in the baseline study
is set at 4%, and life span for the project is 20 years. Table 4.5 provides the variable
explanation and values used in the analysis.
Table 4.4 GDP impacts and the total multiplier effects of CAPEX and OPEX for the Green & Blue
concept in Taiwan
Cost
(million $NT)
GDP impacts
(million $NT)
Employment
impact (FTE)
Multiplier effect
Per annum
Leisure
CAPEX
1767
670
547
1.91
OPEX
(annual)
179
189
104
2.19
Aquaculture
CAPEX
2759,21
955
753
1.83
OPEX
(annual)
1565
672
580
1.85
Energy
CAPEX
3198
1118
878
1.95
OPEX
(annual)
1448
542
391
1.72
Total monetary
Value
CAPEX
7724
2743
2178
–
OPEX
(annual)
3192
1403
1075
–
2 The employment effect is estimated according to contribution of GDP to employment in Gran
Canaria. The assumption is made due to lack of data in Taiwan.
3 The GDP effects of CAPEX and OPEX are calculated by using regional input and output model.
Details refer to TROPOS (2014).
72
W. Chen et al.