

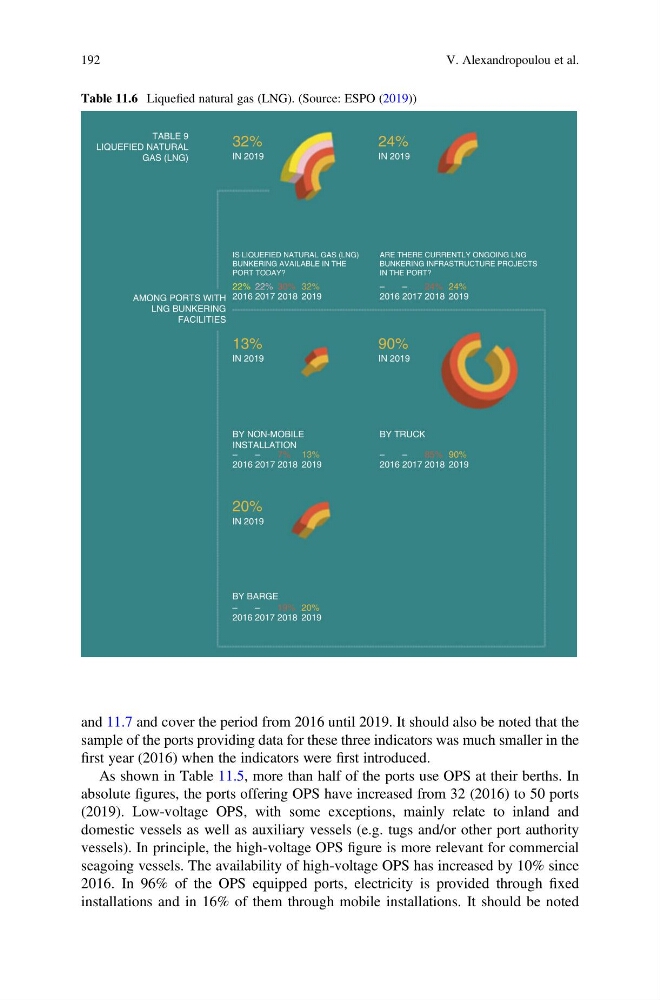
and 11.7 and cover the period from 2016 until 2019. It should also be noted that the
sample of the ports providing data for these three indicators was much smaller in the
first year (2016) when the indicators were first introduced.
As shown in Table 11.5, more than half of the ports use OPS at their berths. In
absolute figures, the ports offering OPS have increased from 32 (2016) to 50 ports
(2019). Low-voltage OPS, with some exceptions, mainly relate to inland and
domestic vessels as well as auxiliary vessels (e.g. tugs and/or other port authority
vessels). In principle, the high-voltage OPS figure is more relevant for commercial
seagoing vessels. The availability of high-voltage OPS has increased by 10% since
2016. In 96% of the OPS equipped ports, electricity is provided through fixed
installations and in 16% of them through mobile installations. It should be noted
Table 11.6 Liquefied natural gas (LNG). (Source: ESPO (2019))
TABLE 9
LIQUEFIED NATURAL
GAS (LNG)
AMONG PORTS WITH
LNG BUNKERING
FACILITIES
IS LIQUEFIED NATURAL GAS (LNG)
BUNKERING AVAILABLE IN THE
PORT TODAY?
ARE THERE CURRENTLY ONGOING LNG
BUNKERING INFRASTRUCTURE PROJECTS
IN THE PORT?
2016
22%
2017
22%
2018
30%
2019
32%
2016
–
2017
–
2018
24%
2019
24%
2016
BY NON-MOBILE
INSTALLATION
BY TRUCK
–
2017
–
2018
7%
2019
13%
2016
–
2017
–
2018
85%
2019
90%
BY BARGE
2016
–
2017
–
2018
19%
2019
20%
IN 2019
32%
IN 2019
24%
IN 2019
13%
IN 2019
20%
IN 2019
90%
192
V. Alexandropoulou et al.
sample of the ports providing data for these three indicators was much smaller in the
first year (2016) when the indicators were first introduced.
As shown in Table 11.5, more than half of the ports use OPS at their berths. In
absolute figures, the ports offering OPS have increased from 32 (2016) to 50 ports
(2019). Low-voltage OPS, with some exceptions, mainly relate to inland and
domestic vessels as well as auxiliary vessels (e.g. tugs and/or other port authority
vessels). In principle, the high-voltage OPS figure is more relevant for commercial
seagoing vessels. The availability of high-voltage OPS has increased by 10% since
2016. In 96% of the OPS equipped ports, electricity is provided through fixed
installations and in 16% of them through mobile installations. It should be noted
Table 11.6 Liquefied natural gas (LNG). (Source: ESPO (2019))
TABLE 9
LIQUEFIED NATURAL
GAS (LNG)
AMONG PORTS WITH
LNG BUNKERING
FACILITIES
IS LIQUEFIED NATURAL GAS (LNG)
BUNKERING AVAILABLE IN THE
PORT TODAY?
ARE THERE CURRENTLY ONGOING LNG
BUNKERING INFRASTRUCTURE PROJECTS
IN THE PORT?
2016
22%
2017
22%
2018
30%
2019
32%
2016
–
2017
–
2018
24%
2019
24%
2016
BY NON-MOBILE
INSTALLATION
BY TRUCK
–
2017
–
2018
7%
2019
13%
2016
–
2017
–
2018
85%
2019
90%
BY BARGE
2016
–
2017
–
2018
19%
2019
20%
IN 2019
32%
IN 2019
24%
IN 2019
13%
IN 2019
20%
IN 2019
90%
192
V. Alexandropoulou et al.