

11.7.2.2 Green Services to Shipping
This section presents the share of EU ports that provide green services to shipping. It
comprises three categories of indicators on the efforts made by the port managing
bodies in order to contribute to greener shipping. These are the provision of onshore
power supply (OPS), the provision of liquefied natural gas (LNG) bunkering facilities and environmentally differentiated port fees aiming to reward front-runners in
the market and ships going beyond regulatory standards.
The EcoPorts SDM was updated in 2016 to enable the monitoring of the status
and evolution of the green services that ports may choose to provide to their
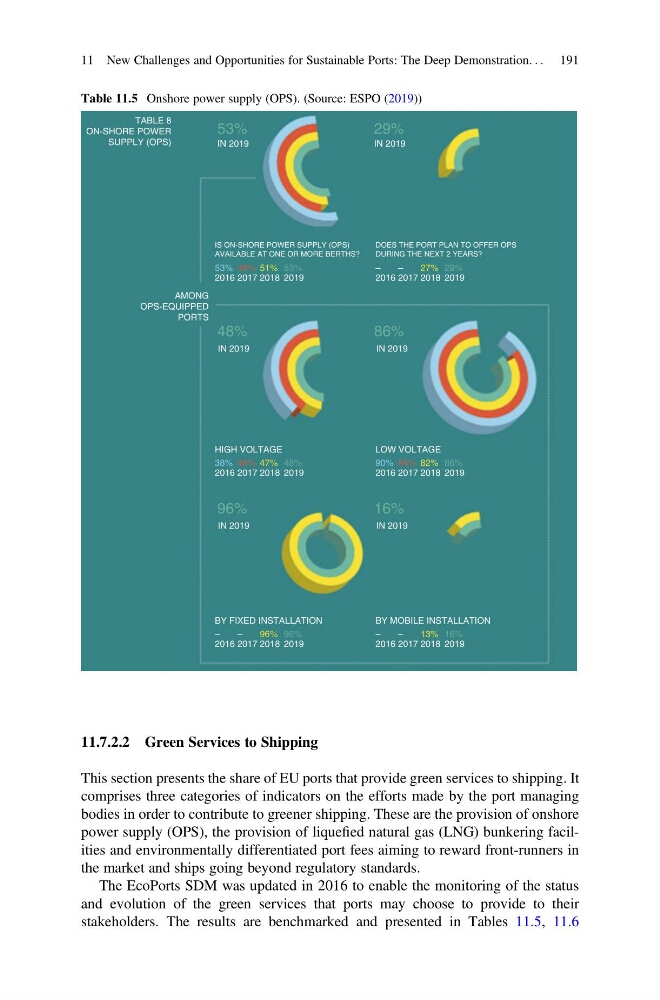
stakeholders. The results are benchmarked and presented in Tables 11.5, 11.6
Table 11.5 Onshore power supply (OPS). (Source: ESPO (2019))
TABLE 8
ON-SHORE POWER
SUPPLY (OPS)
AMONG
OPS-EQUIPPED
PORTS
IN 2019
IN 2019
2016
IN 2019
IN 2019
IN 2019
IN 2019
HIGH VOLTAGE
LOW VOLTAGE
53%
2017
IS ON-SHORE POWER SUPPLY (OPS)
AVAILABLE AT ONE OR MORE BERTHS?
DOES THE PORT PLAN TO OFFER OPS
DURING THE NEXT 2 YEARS?
48%
2018
51%
2019
53%
2016
–
2017
–
2018
27%
2019
29%
2016
38%
2017
40%
2018
47%
2019
48%
2016
90%
2017
84%
2018
82%
2019
86%
BY FIXED INSTALLATION
BY MOBILE INSTALLATION
2016
–
2017
–
2018
96%
2019
96%
2016
–
2017
–
2018
13%
2019
16%
53%
29%
48%
86%
96%
16%
11 New Challenges and Opportunities for Sustainable Ports: The Deep Demonstration. . . 191
This section presents the share of EU ports that provide green services to shipping. It
comprises three categories of indicators on the efforts made by the port managing
bodies in order to contribute to greener shipping. These are the provision of onshore
power supply (OPS), the provision of liquefied natural gas (LNG) bunkering facilities and environmentally differentiated port fees aiming to reward front-runners in
the market and ships going beyond regulatory standards.
The EcoPorts SDM was updated in 2016 to enable the monitoring of the status
and evolution of the green services that ports may choose to provide to their
stakeholders. The results are benchmarked and presented in Tables 11.5, 11.6
Table 11.5 Onshore power supply (OPS). (Source: ESPO (2019))
TABLE 8
ON-SHORE POWER
SUPPLY (OPS)
AMONG
OPS-EQUIPPED
PORTS
IN 2019
IN 2019
2016
IN 2019
IN 2019
IN 2019
IN 2019
HIGH VOLTAGE
LOW VOLTAGE
53%
2017
IS ON-SHORE POWER SUPPLY (OPS)
AVAILABLE AT ONE OR MORE BERTHS?
DOES THE PORT PLAN TO OFFER OPS
DURING THE NEXT 2 YEARS?
48%
2018
51%
2019
53%
2016
–
2017
–
2018
27%
2019
29%
2016
38%
2017
40%
2018
47%
2019
48%
2016
90%
2017
84%
2018
82%
2019
86%
BY FIXED INSTALLATION
BY MOBILE INSTALLATION
2016
–
2017
–
2018
96%
2019
96%
2016
–
2017
–
2018
13%
2019
16%
53%
29%
48%
86%
96%
16%
11 New Challenges and Opportunities for Sustainable Ports: The Deep Demonstration. . . 191