

76
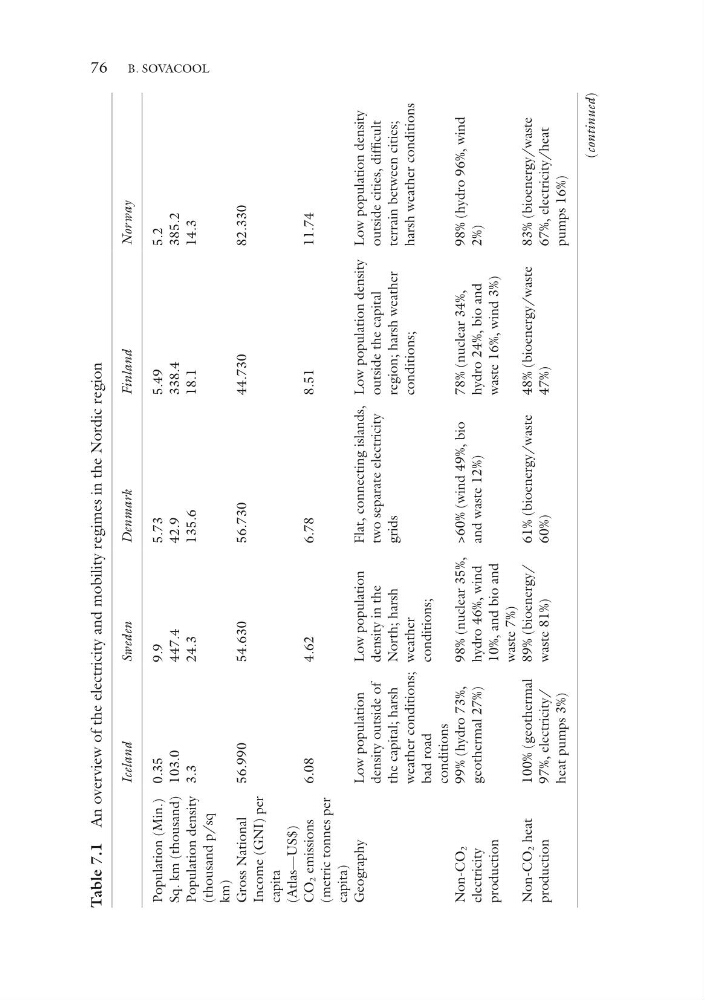
Table 7.1 An overview of the electricity and mobility regimes in the Nordic region
Iceland
Sweden
Denmark
Finland
Norway
Population (Min.) 0.35
9.9
5.73
5.49
5.2
Sq. km (thousand) 103.0
447.4
42.9
338.4
385.2
Population density
(thousand p/sq
km)
3.3
24.3
135.6
18.1
14.3
Gross National
Income (GNI) per
capita
(Atlas—US$)
56.990
54.630
56.730
44.730
82.330
CO
2 emissions
(metric tonnes per
capita)
6.08
4.62
6.78
8.51
11.74
Geography
Low population
density outside of
the capital; harsh
weather conditions;
bad road
conditions
Low population
density in the
North; harsh
weather
conditions;
Flat, connecting islands,
two separate electricity
grids
Low population density
outside the capital
region; harsh weather
conditions;
Low population density
outside cities, difficult
terrain between cities;
harsh weather conditions
Non-CO
2
electricity
production
99% (hydro 73%,
geothermal 27%)
98% (nuclear 35%,
hydro 46%, wind
10%, and bio and
waste 7%)
>60% (wind 49%, bio
and waste 12%)
78% (nuclear 34%,
hydro 24%, bio and
waste 16%, wind 3%)
98% (hydro 96%, wind
2%)
Non-CO
2 heat
production
100% (geothermal
97%, electricity/
heat pumps 3%)
89% (bioenergy/
waste 81%)
61% (bioenergy/waste
60%)
48% (bioenergy/waste
47%)
83% (bioenergy/waste
67%, electricity/heat
pumps 16%)
(continued)
B. SOVACOOL
Table 7.1 An overview of the electricity and mobility regimes in the Nordic region
Iceland
Sweden
Denmark
Finland
Norway
Population (Min.) 0.35
9.9
5.73
5.49
5.2
Sq. km (thousand) 103.0
447.4
42.9
338.4
385.2
Population density
(thousand p/sq
km)
3.3
24.3
135.6
18.1
14.3
Gross National
Income (GNI) per
capita
(Atlas—US$)
56.990
54.630
56.730
44.730
82.330
CO
2 emissions
(metric tonnes per
capita)
6.08
4.62
6.78
8.51
11.74
Geography
Low population
density outside of
the capital; harsh
weather conditions;
bad road
conditions
Low population
density in the
North; harsh
weather
conditions;
Flat, connecting islands,
two separate electricity
grids
Low population density
outside the capital
region; harsh weather
conditions;
Low population density
outside cities, difficult
terrain between cities;
harsh weather conditions
Non-CO
2
electricity
production
99% (hydro 73%,
geothermal 27%)
98% (nuclear 35%,
hydro 46%, wind
10%, and bio and
waste 7%)
>60% (wind 49%, bio
and waste 12%)
78% (nuclear 34%,
hydro 24%, bio and
waste 16%, wind 3%)
98% (hydro 96%, wind
2%)
Non-CO
2 heat
production
100% (geothermal
97%, electricity/
heat pumps 3%)
89% (bioenergy/
waste 81%)
61% (bioenergy/waste
60%)
48% (bioenergy/waste
47%)
83% (bioenergy/waste
67%, electricity/heat
pumps 16%)
(continued)
B. SOVACOOL