

3 • Propriétés
des corps purs
100
3.3 Les gaz à un constituant
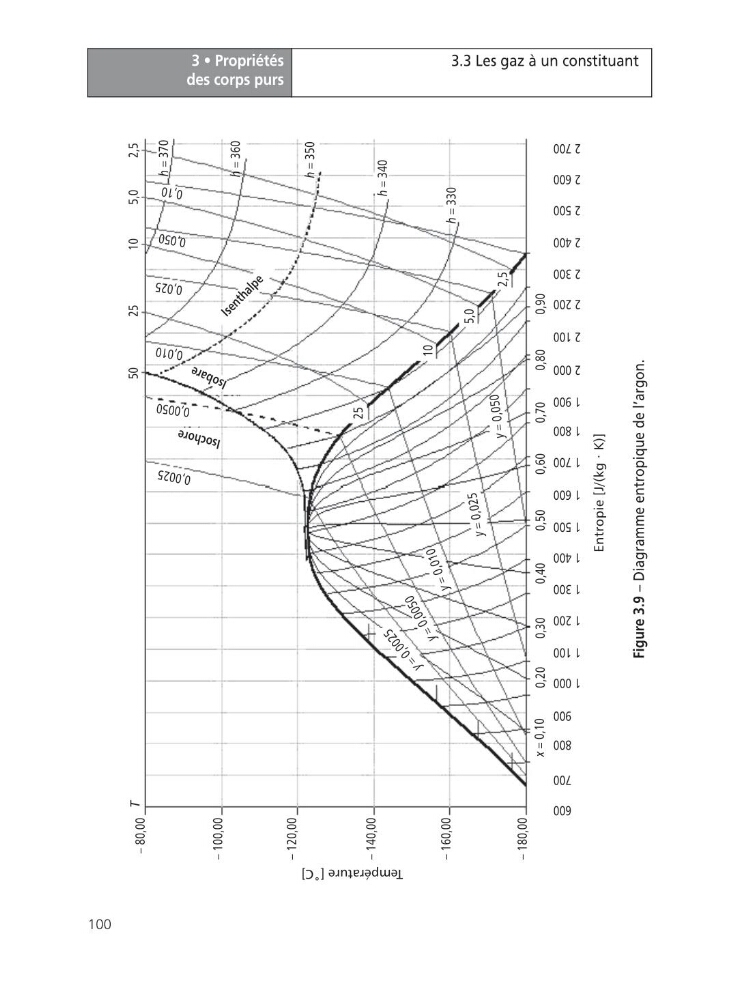
Figure 3.9 – Diagramme entropique de l’argon.
– 80,00
– 100,00
– 120,00
– 140,00
– 160,00
– 180,00
Température [˚C]
x
= 0,10
0,20
0,30
0,40
0,50
0,60
0,70
0,80
0,90
600
700
800
900
1 000
1 100
1 200
1 300
1 400
1 500
1 600
1 700
1 800
1 900
2 000
2 100
2 200
2 300
2 400
2 500
2 600
2 700
Entropie [J/(kg .
K)]
y
=
0
,
0
0
2
5
y
=
0
,0
0
5
0
y
=
0
,0
1
0
y
= 0,0
25
y
= 0,05
0
2,5
5,0
25
10
0,0
02
5
0,0
050
0,0
10
0,0
25
0,0
50
0,1
0
50
25
10
5,0
2,5
T
h
= 370
h
= 360
h
= 350
h
= 340
h
= 330
Iso
ch
or
e
Is
o
b
a
re
I s e n t h a l p e
des corps purs
100
3.3 Les gaz à un constituant
Figure 3.9 – Diagramme entropique de l’argon.
– 80,00
– 100,00
– 120,00
– 140,00
– 160,00
– 180,00
Température [˚C]
x
= 0,10
0,20
0,30
0,40
0,50
0,60
0,70
0,80
0,90
600
700
800
900
1 000
1 100
1 200
1 300
1 400
1 500
1 600
1 700
1 800
1 900
2 000
2 100
2 200
2 300
2 400
2 500
2 600
2 700
Entropie [J/(kg .
K)]
y
=
0
,
0
0
2
5
y
=
0
,0
0
5
0
y
=
0
,0
1
0
y
= 0,0
25
y
= 0,05
0
2,5
5,0
25
10
0,0
02
5
0,0
050
0,0
10
0,0
25
0,0
50
0,1
0
50
25
10
5,0
2,5
T
h
= 370
h
= 360
h
= 350
h
= 340
h
= 330
Iso
ch
or
e
Is
o
b
a
re
I s e n t h a l p e