

by 40%. In December 2016 the average capex of
solar fell below that of onshore wind in 58
non-OECD countries, a significant milestone as
solar prices have fallen far faster than most
analysts had forecast.
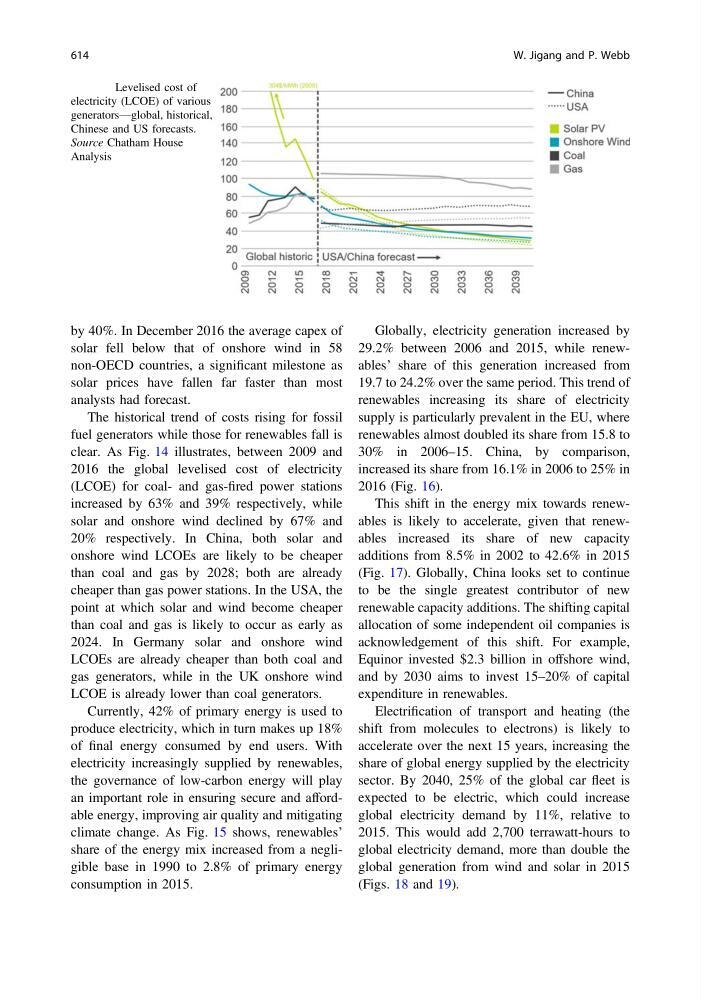
The historical trend of costs rising for fossil
fuel generators while those for renewables fall is
clear. As Fig. 14 illustrates, between 2009 and
2016 the global levelised cost of electricity
(LCOE) for coal- and gas-fired power stations
increased by 63% and 39% respectively, while
solar and onshore wind declined by 67% and
20% respectively. In China, both solar and
onshore wind LCOEs are likely to be cheaper
than coal and gas by 2028; both are already
cheaper than gas power stations. In the USA, the
point at which solar and wind become cheaper
than coal and gas is likely to occur as early as
2024. In Germany solar and onshore wind
LCOEs are already cheaper than both coal and
gas generators, while in the UK onshore wind
LCOE is already lower than coal generators.
Currently, 42% of primary energy is used to
produce electricity, which in turn makes up 18%
of final energy consumed by end users. With
electricity increasingly supplied by renewables,
the governance of low-carbon energy will play
an important role in ensuring secure and affordable energy, improving air quality and mitigating
climate change. As Fig. 15 shows, renewables’
share of the energy mix increased from a negligible base in 1990 to 2.8% of primary energy
consumption in 2015.
Globally, electricity generation increased by
29.2% between 2006 and 2015, while renewables’ share of this generation increased from
19.7 to 24.2% over the same period. This trend of
renewables increasing its share of electricity
supply is particularly prevalent in the EU, where
renewables almost doubled its share from 15.8 to
30% in 2006–15. China, by comparison,
increased its share from 16.1% in 2006 to 25% in
2016 (Fig. 16).
This shift in the energy mix towards renewables is likely to accelerate, given that renewables increased its share of new capacity
additions from 8.5% in 2002 to 42.6% in 2015
(Fig. 17). Globally, China looks set to continue
to be the single greatest contributor of new
renewable capacity additions. The shifting capital
allocation of some independent oil companies is
acknowledgement of this shift. For example,
Equinor invested $2.3 billion in offshore wind,
and by 2030 aims to invest 15–20% of capital
expenditure in renewables.
Electrification of transport and heating (the
shift from molecules to electrons) is likely to
accelerate over the next 15 years, increasing the
share of global energy supplied by the electricity
sector. By 2040, 25% of the global car fleet is
expected to be electric, which could increase
global electricity demand by 11%, relative to
2015. This would add 2,700 terrawatt-hours to
global electricity demand, more than double the
global generation from wind and solar in 2015
(Figs. 18 and 19).
Fig. 14 Levelised cost of
electricity (LCOE) of various
generators—global, historical,
Chinese and US forecasts.
Source Chatham House
Analysis
614
W. Jigang and P. Webb