

3.3 Energy Demand Growth
and Access to Energy
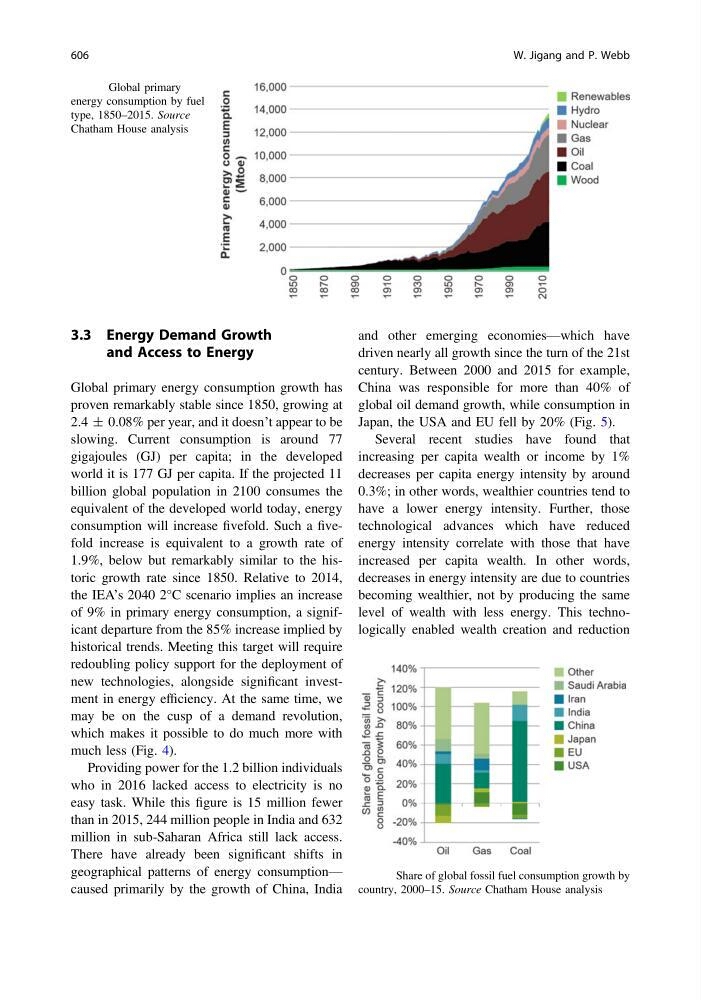
Global primary energy consumption growth has
proven remarkably stable since 1850, growing at
2.4 ± 0.08% per year, and it doesn’t appear to be
slowing. Current consumption is around 77
gigajoules (GJ) per capita; in the developed
world it is 177 GJ per capita. If the projected 11
billion global population in 2100 consumes the
equivalent of the developed world today, energy
consumption will increase fivefold. Such a fivefold increase is equivalent to a growth rate of
1.9%, below but remarkably similar to the historic growth rate since 1850. Relative to 2014,
the IEA’s 2040 2°C scenario implies an increase
of 9% in primary energy consumption, a significant departure from the 85% increase implied by
historical trends. Meeting this target will require
redoubling policy support for the deployment of
new technologies, alongside significant investment in energy efficiency. At the same time, we
may be on the cusp of a demand revolution,
which makes it possible to do much more with
much less (Fig. 4).
Providing power for the 1.2 billion individuals
who in 2016 lacked access to electricity is no
easy task. While this figure is 15 million fewer
than in 2015, 244 million people in India and 632
million in sub-Saharan Africa still lack access.
There have already been significant shifts in
geographical patterns of energy consumption—
caused primarily by the growth of China, India
and other emerging economies—which have
driven nearly all growth since the turn of the 21st
century. Between 2000 and 2015 for example,
China was responsible for more than 40% of
global oil demand growth, while consumption in
Japan, the USA and EU fell by 20% (Fig. 5).
Several recent studies have found that
increasing per capita wealth or income by 1%
decreases per capita energy intensity by around
0.3%; in other words, wealthier countries tend to
have a lower energy intensity. Further, those
technological advances which have reduced
energy intensity correlate with those that have
increased per capita wealth. In other words,
decreases in energy intensity are due to countries
becoming wealthier, not by producing the same
level of wealth with less energy. This technologically enabled wealth creation and reduction
Fig. 4 Global primary
energy consumption by fuel
type, 1850–2015. Source
Chatham House analysis
Fig. 5 Share of global fossil fuel consumption growth by
country, 2000–15. Source Chatham House analysis
606
W. Jigang and P. Webb