

general government revenues, or be directly tied
to other spending programmes. For instance, in
the EU at least half of all auction revenues must
be used for climate- or energy-related purposes
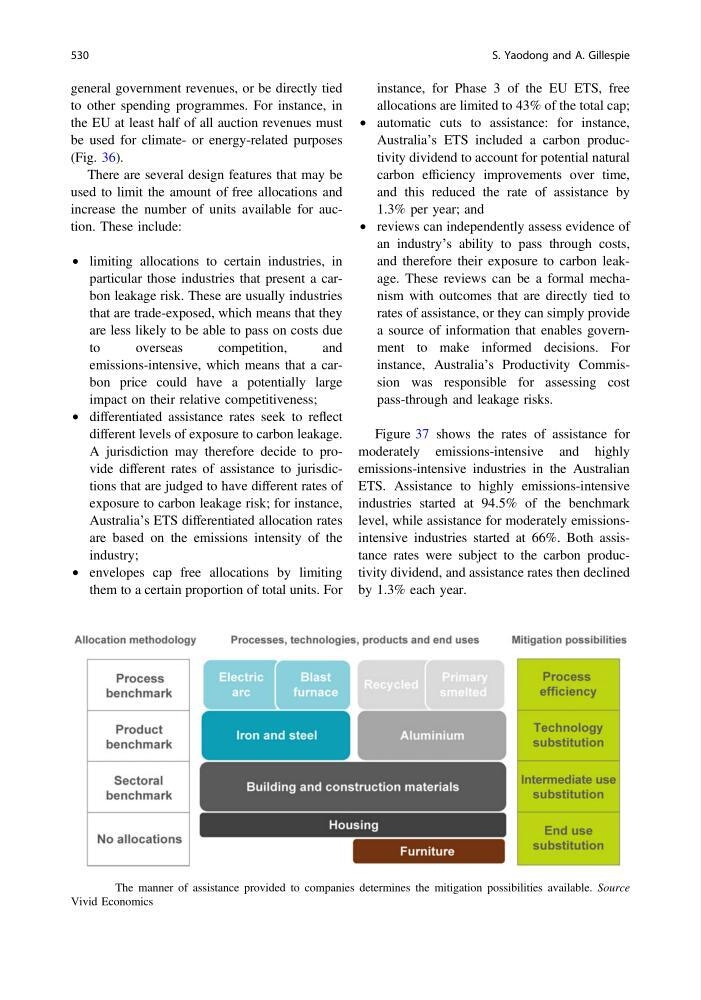
(Fig. 36).
There are several design features that may be
used to limit the amount of free allocations and
increase the number of units available for auction. These include:
• limiting allocations to certain industries, in
particular those industries that present a carbon leakage risk. These are usually industries
that are trade-exposed, which means that they
are less likely to be able to pass on costs due
to
overseas
competition,
and
emissions-intensive, which means that a carbon price could have a potentially large
impact on their relative competitiveness;
• differentiated assistance rates seek to reflect
different levels of exposure to carbon leakage.
A jurisdiction may therefore decide to provide different rates of assistance to jurisdictions that are judged to have different rates of
exposure to carbon leakage risk; for instance,
Australia’s ETS differentiated allocation rates
are based on the emissions intensity of the
industry;
• envelopes cap free allocations by limiting
them to a certain proportion of total units. For
instance, for Phase 3 of the EU ETS, free
allocations are limited to 43% of the total cap;
• automatic cuts to assistance: for instance,
Australia’s ETS included a carbon productivity dividend to account for potential natural
carbon efficiency improvements over time,
and this reduced the rate of assistance by
1.3% per year; and
• reviews can independently assess evidence of
an industry’s ability to pass through costs,
and therefore their exposure to carbon leakage. These reviews can be a formal mechanism with outcomes that are directly tied to
rates of assistance, or they can simply provide
a source of information that enables government to make informed decisions. For
instance, Australia’s Productivity Commission was responsible for assessing cost
pass-through and leakage risks.
Figure 37 shows the rates of assistance for
moderately emissions-intensive and highly
emissions-intensive industries in the Australian
ETS. Assistance to highly emissions-intensive
industries started at 94.5% of the benchmark
level, while assistance for moderately emissionsintensive industries started at 66%. Both assistance rates were subject to the carbon productivity dividend, and assistance rates then declined
by 1.3% each year.
Fig. 36 The manner of assistance provided to companies determines the mitigation possibilities available. Source
Vivid Economics
530
S. Yaodong and A. Gillespie
to other spending programmes. For instance, in
the EU at least half of all auction revenues must
be used for climate- or energy-related purposes
(Fig. 36).
There are several design features that may be
used to limit the amount of free allocations and
increase the number of units available for auction. These include:
• limiting allocations to certain industries, in
particular those industries that present a carbon leakage risk. These are usually industries
that are trade-exposed, which means that they
are less likely to be able to pass on costs due
to
overseas
competition,
and
emissions-intensive, which means that a carbon price could have a potentially large
impact on their relative competitiveness;
• differentiated assistance rates seek to reflect
different levels of exposure to carbon leakage.
A jurisdiction may therefore decide to provide different rates of assistance to jurisdictions that are judged to have different rates of
exposure to carbon leakage risk; for instance,
Australia’s ETS differentiated allocation rates
are based on the emissions intensity of the
industry;
• envelopes cap free allocations by limiting
them to a certain proportion of total units. For
instance, for Phase 3 of the EU ETS, free
allocations are limited to 43% of the total cap;
• automatic cuts to assistance: for instance,
Australia’s ETS included a carbon productivity dividend to account for potential natural
carbon efficiency improvements over time,
and this reduced the rate of assistance by
1.3% per year; and
• reviews can independently assess evidence of
an industry’s ability to pass through costs,
and therefore their exposure to carbon leakage. These reviews can be a formal mechanism with outcomes that are directly tied to
rates of assistance, or they can simply provide
a source of information that enables government to make informed decisions. For
instance, Australia’s Productivity Commission was responsible for assessing cost
pass-through and leakage risks.
Figure 37 shows the rates of assistance for
moderately emissions-intensive and highly
emissions-intensive industries in the Australian
ETS. Assistance to highly emissions-intensive
industries started at 94.5% of the benchmark
level, while assistance for moderately emissionsintensive industries started at 66%. Both assistance rates were subject to the carbon productivity dividend, and assistance rates then declined
by 1.3% each year.
Fig. 36 The manner of assistance provided to companies determines the mitigation possibilities available. Source
Vivid Economics
530
S. Yaodong and A. Gillespie