

production landscape is changing. In 2016,
demand for renewable energy grew by 12%
(including wind, geothermal, solar, biomass,
waste-to-energy and biofuels, excluding hydropower). Although this is lower than the average
growth rate of 15.7% in 2006–16, it still represents the biggest annual increase ever (a rise of
55 Mtoe, which is more than the decline in coal
demand). In the same year, China became the
world’s largest renewable energy producer ahead
of the USA. Although renewable energy only
accounts for 4% of global primary energy
demand and the average growth rate of some
renewable energy sources, including nuclear and
hydro, is only 2.64%, new energy is expected to
remain the major driver of the energy revolution
and will play a major role in driving economic
growth in the future.
Figure 4 shows that growth in energy demand
to 2035 comes entirely from emerging economies, with China and India accounting for more
than half of the increase. In contrast, oil demand
in OECD countries will continue to fall steadily.
In terms of oil supply, non-OPEC countries are
the main source of increased supply, producing
11 million barrels per day (MMbbl/d) compared
to 7 MMbbl/d in OPEC countries. The increase
in non-OPEC oil supply comes entirely from the
Americas: shale oil from the USA, deep-sea oil
from Brazil, and the oil sands of Canada (BP
2016) (Fig. 5).
BP estimates (BP 2016) that the average
annual growth rate of global natural gas demand
will reach 1.8% in 2014–35, making natural gas
the fastest growing fossil energy source. This
robust growth is the result of focused supply and
environmental policy support. The increase in
natural gas demand comes mainly from emerging
economies, with about 30% from China and
India and more than 20% from the Middle East.
Industry and power generation are behind the
increase, whereas in OECD countries the
increase is primarily from power generation.
World shale gas production is rising. In 2014–35,
the average annual growth rate of shale gas
production is expected to reach 5.6%, and its
share of total natural gas production will be
almost 25%. In 2014–25, nearly all the increase
in shale gas output will be contributed by the
USA. By 2035, China is expected to become the
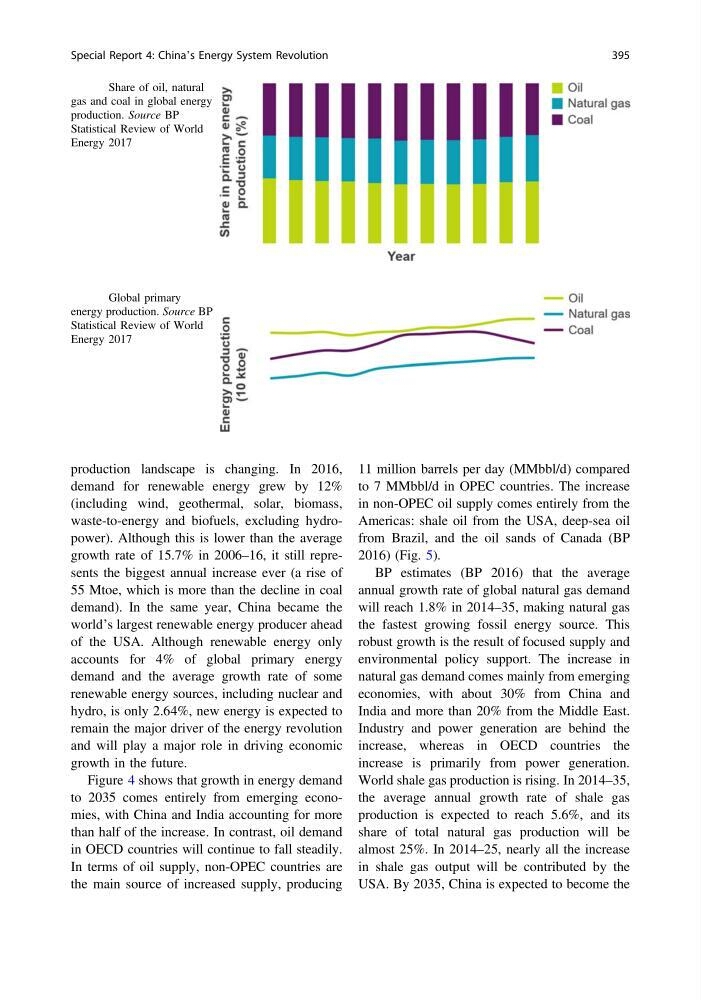
Fig. 1 Share of oil, natural
gas and coal in global energy
production. Source BP
Statistical Review of World
Energy 2017
Fig. 2 Global primary
energy production. Source BP
Statistical Review of World
Energy 2017
Special Report 4: China’s Energy System Revolution
395
demand for renewable energy grew by 12%
(including wind, geothermal, solar, biomass,
waste-to-energy and biofuels, excluding hydropower). Although this is lower than the average
growth rate of 15.7% in 2006–16, it still represents the biggest annual increase ever (a rise of
55 Mtoe, which is more than the decline in coal
demand). In the same year, China became the
world’s largest renewable energy producer ahead
of the USA. Although renewable energy only
accounts for 4% of global primary energy
demand and the average growth rate of some
renewable energy sources, including nuclear and
hydro, is only 2.64%, new energy is expected to
remain the major driver of the energy revolution
and will play a major role in driving economic
growth in the future.
Figure 4 shows that growth in energy demand
to 2035 comes entirely from emerging economies, with China and India accounting for more
than half of the increase. In contrast, oil demand
in OECD countries will continue to fall steadily.
In terms of oil supply, non-OPEC countries are
the main source of increased supply, producing
11 million barrels per day (MMbbl/d) compared
to 7 MMbbl/d in OPEC countries. The increase
in non-OPEC oil supply comes entirely from the
Americas: shale oil from the USA, deep-sea oil
from Brazil, and the oil sands of Canada (BP
2016) (Fig. 5).
BP estimates (BP 2016) that the average
annual growth rate of global natural gas demand
will reach 1.8% in 2014–35, making natural gas
the fastest growing fossil energy source. This
robust growth is the result of focused supply and
environmental policy support. The increase in
natural gas demand comes mainly from emerging
economies, with about 30% from China and
India and more than 20% from the Middle East.
Industry and power generation are behind the
increase, whereas in OECD countries the
increase is primarily from power generation.
World shale gas production is rising. In 2014–35,
the average annual growth rate of shale gas
production is expected to reach 5.6%, and its
share of total natural gas production will be
almost 25%. In 2014–25, nearly all the increase
in shale gas output will be contributed by the
USA. By 2035, China is expected to become the
Fig. 1 Share of oil, natural
gas and coal in global energy
production. Source BP
Statistical Review of World
Energy 2017
Fig. 2 Global primary
energy production. Source BP
Statistical Review of World
Energy 2017
Special Report 4: China’s Energy System Revolution
395