

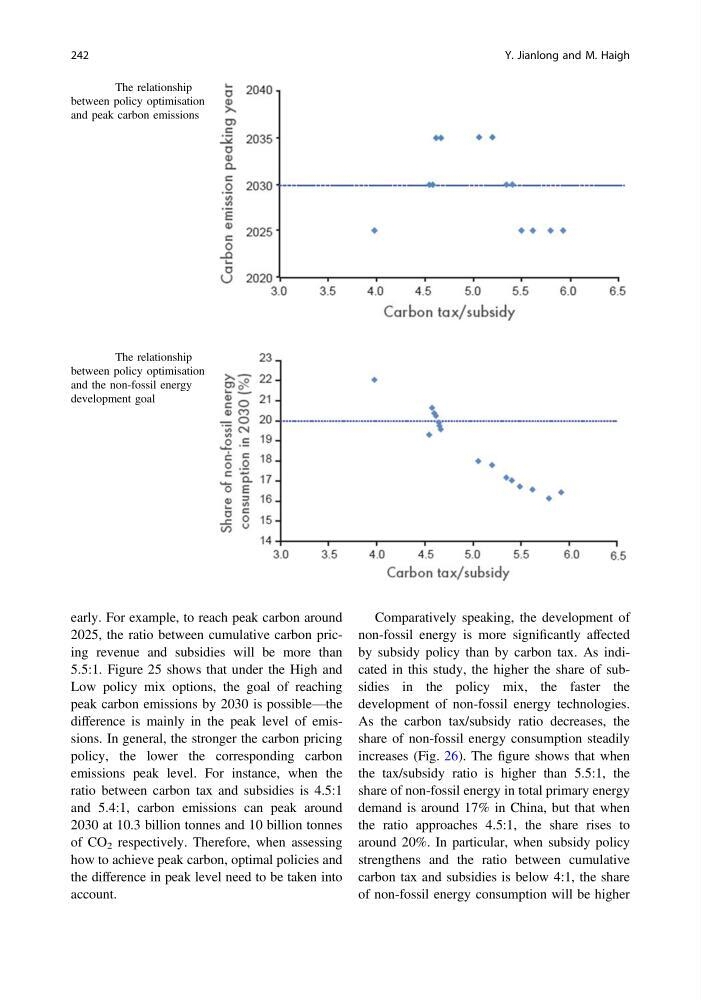
early. For example, to reach peak carbon around
2025, the ratio between cumulative carbon pricing revenue and subsidies will be more than
5.5:1. Figure 25 shows that under the High and
Low policy mix options, the goal of reaching
peak carbon emissions by 2030 is possible—the
difference is mainly in the peak level of emissions. In general, the stronger the carbon pricing
policy, the lower the corresponding carbon
emissions peak level. For instance, when the
ratio between carbon tax and subsidies is 4.5:1
and 5.4:1, carbon emissions can peak around
2030 at 10.3 billion tonnes and 10 billion tonnes
of CO 2 respectively. Therefore, when assessing
how to achieve peak carbon, optimal policies and
the difference in peak level need to be taken into
account.
Comparatively speaking, the development of
non-fossil energy is more significantly affected
by subsidy policy than by carbon tax. As indicated in this study, the higher the share of subsidies in the policy mix, the faster the
development of non-fossil energy technologies.
As the carbon tax/subsidy ratio decreases, the
share of non-fossil energy consumption steadily
increases (Fig. 26). The figure shows that when
the tax/subsidy ratio is higher than 5.5:1, the
share of non-fossil energy in total primary energy
demand is around 17% in China, but that when
the ratio approaches 4.5:1, the share rises to
around 20%. In particular, when subsidy policy
strengthens and the ratio between cumulative
carbon tax and subsidies is below 4:1, the share
of non-fossil energy consumption will be higher
Fig. 25 The relationship
between policy optimisation
and peak carbon emissions
Fig. 26 The relationship
between policy optimisation
and the non-fossil energy
development goal
242
Y. Jianlong and M. Haigh
2025, the ratio between cumulative carbon pricing revenue and subsidies will be more than
5.5:1. Figure 25 shows that under the High and
Low policy mix options, the goal of reaching
peak carbon emissions by 2030 is possible—the
difference is mainly in the peak level of emissions. In general, the stronger the carbon pricing
policy, the lower the corresponding carbon
emissions peak level. For instance, when the
ratio between carbon tax and subsidies is 4.5:1
and 5.4:1, carbon emissions can peak around
2030 at 10.3 billion tonnes and 10 billion tonnes
of CO 2 respectively. Therefore, when assessing
how to achieve peak carbon, optimal policies and
the difference in peak level need to be taken into
account.
Comparatively speaking, the development of
non-fossil energy is more significantly affected
by subsidy policy than by carbon tax. As indicated in this study, the higher the share of subsidies in the policy mix, the faster the
development of non-fossil energy technologies.
As the carbon tax/subsidy ratio decreases, the
share of non-fossil energy consumption steadily
increases (Fig. 26). The figure shows that when
the tax/subsidy ratio is higher than 5.5:1, the
share of non-fossil energy in total primary energy
demand is around 17% in China, but that when
the ratio approaches 4.5:1, the share rises to
around 20%. In particular, when subsidy policy
strengthens and the ratio between cumulative
carbon tax and subsidies is below 4:1, the share
of non-fossil energy consumption will be higher
Fig. 25 The relationship
between policy optimisation
and peak carbon emissions
Fig. 26 The relationship
between policy optimisation
and the non-fossil energy
development goal
242
Y. Jianlong and M. Haigh