

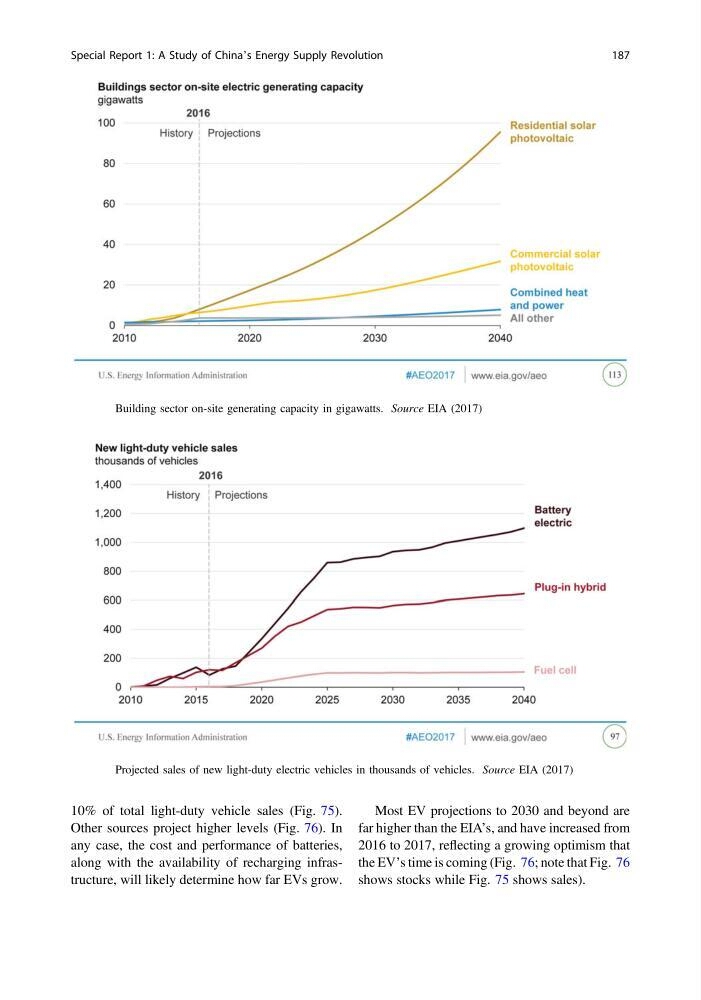
10% of total light-duty vehicle sales (Fig. 75).
Other sources project higher levels (Fig. 76). In
any case, the cost and performance of batteries,
along with the availability of recharging infrastructure, will likely determine how far EVs grow.
Most EV projections to 2030 and beyond are
far higher than the EIA’s, and have increased from
2016 to 2017, reflecting a growing optimism that
the EV’s time is coming (Fig. 76; note that Fig. 76
shows stocks while Fig. 75 shows sales).
Fig. 74 Building sector on-site generating capacity in gigawatts. Source EIA (2017)
Fig. 75 Projected sales of new light-duty electric vehicles in thousands of vehicles. Source EIA (2017)
Special Report 1: A Study of China’s Energy Supply Revolution
187
Other sources project higher levels (Fig. 76). In
any case, the cost and performance of batteries,
along with the availability of recharging infrastructure, will likely determine how far EVs grow.
Most EV projections to 2030 and beyond are
far higher than the EIA’s, and have increased from
2016 to 2017, reflecting a growing optimism that
the EV’s time is coming (Fig. 76; note that Fig. 76
shows stocks while Fig. 75 shows sales).
Fig. 74 Building sector on-site generating capacity in gigawatts. Source EIA (2017)
Fig. 75 Projected sales of new light-duty electric vehicles in thousands of vehicles. Source EIA (2017)
Special Report 1: A Study of China’s Energy Supply Revolution
187