

7 The Challenges of the Oil Spill Preparedness …
61
7.3 Data for Oil Spill Incidents
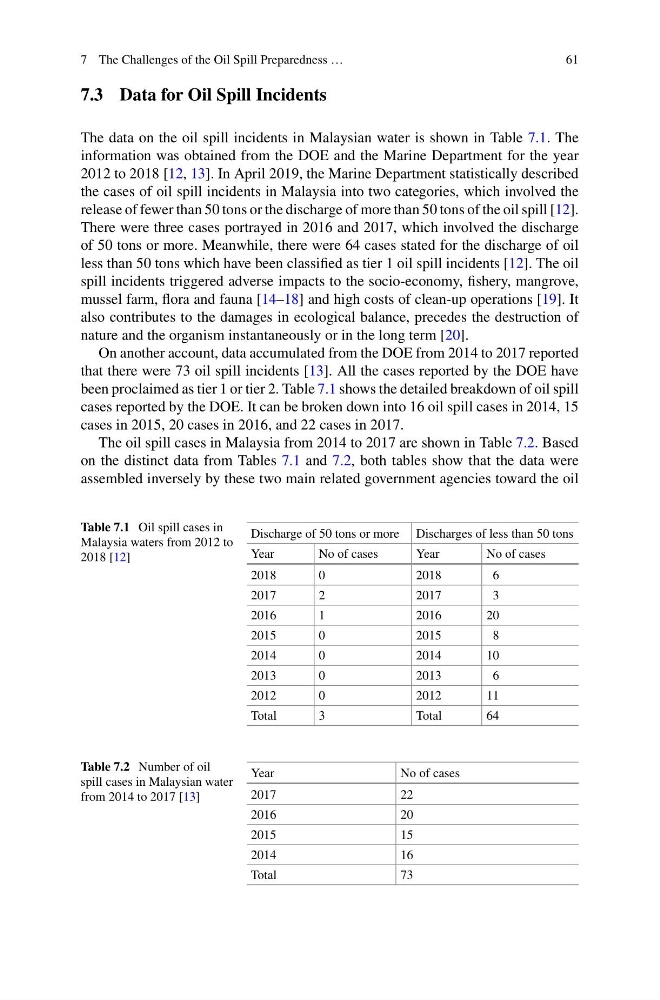
The data on the oil spill incidents in Malaysian water is shown in Table 7.1. The
information was obtained from the DOE and the Marine Department for the year
2012 to 2018 [12, 13]. In April 2019, the Marine Department statistically described
the cases of oil spill incidents in Malaysia into two categories, which involved the
release of fewer than 50 tons or the discharge of more than 50 tons of the oil spill [12].
There were three cases portrayed in 2016 and 2017, which involved the discharge
of 50 tons or more. Meanwhile, there were 64 cases stated for the discharge of oil
less than 50 tons which have been classified as tier 1 oil spill incidents [12]. The oil
spill incidents triggered adverse impacts to the socio-economy, fishery, mangrove,
mussel farm, flora and fauna [14–18] and high costs of clean-up operations [19]. It
also contributes to the damages in ecological balance, precedes the destruction of
nature and the organism instantaneously or in the long term [20].
On another account, data accumulated from the DOE from 2014 to 2017 reported
that there were 73 oil spill incidents [13]. All the cases reported by the DOE have
been proclaimed as tier 1 or tier 2. Table 7.1 shows the detailed breakdown of oil spill
cases reported by the DOE. It can be broken down into 16 oil spill cases in 2014, 15
cases in 2015, 20 cases in 2016, and 22 cases in 2017.
The oil spill cases in Malaysia from 2014 to 2017 are shown in Table 7.2. Based
on the distinct data from Tables 7.1 and 7.2, both tables show that the data were
assembled inversely by these two main related government agencies toward the oil
Table 7.1 Oil spill cases in
Malaysia waters from 2012 to
2018 [12]
Discharge of 50 tons or more Discharges of less than 50 tons
Year
No of cases
Year
No of cases
2018
0
2018
6
2017
2
2017
3
2016
1
2016
20
2015
0
2015
8
2014
0
2014
10
2013
0
2013
6
2012
0
2012
11
Total
3
Total
64
Table 7.2 Number of oil
spill cases in Malaysian water
from 2014 to 2017 [13]
Year
No of cases
2017
22
2016
20
2015
15
2014
16
Total
73
61
7.3 Data for Oil Spill Incidents
The data on the oil spill incidents in Malaysian water is shown in Table 7.1. The
information was obtained from the DOE and the Marine Department for the year
2012 to 2018 [12, 13]. In April 2019, the Marine Department statistically described
the cases of oil spill incidents in Malaysia into two categories, which involved the
release of fewer than 50 tons or the discharge of more than 50 tons of the oil spill [12].
There were three cases portrayed in 2016 and 2017, which involved the discharge
of 50 tons or more. Meanwhile, there were 64 cases stated for the discharge of oil
less than 50 tons which have been classified as tier 1 oil spill incidents [12]. The oil
spill incidents triggered adverse impacts to the socio-economy, fishery, mangrove,
mussel farm, flora and fauna [14–18] and high costs of clean-up operations [19]. It
also contributes to the damages in ecological balance, precedes the destruction of
nature and the organism instantaneously or in the long term [20].
On another account, data accumulated from the DOE from 2014 to 2017 reported
that there were 73 oil spill incidents [13]. All the cases reported by the DOE have
been proclaimed as tier 1 or tier 2. Table 7.1 shows the detailed breakdown of oil spill
cases reported by the DOE. It can be broken down into 16 oil spill cases in 2014, 15
cases in 2015, 20 cases in 2016, and 22 cases in 2017.
The oil spill cases in Malaysia from 2014 to 2017 are shown in Table 7.2. Based
on the distinct data from Tables 7.1 and 7.2, both tables show that the data were
assembled inversely by these two main related government agencies toward the oil
Table 7.1 Oil spill cases in
Malaysia waters from 2012 to
2018 [12]
Discharge of 50 tons or more Discharges of less than 50 tons
Year
No of cases
Year
No of cases
2018
0
2018
6
2017
2
2017
3
2016
1
2016
20
2015
0
2015
8
2014
0
2014
10
2013
0
2013
6
2012
0
2012
11
Total
3
Total
64
Table 7.2 Number of oil
spill cases in Malaysian water
from 2014 to 2017 [13]
Year
No of cases
2017
22
2016
20
2015
15
2014
16
Total
73