

2 The Determinants for Successful Ferry Operation …
17
Table 2.1 Reliability Statistics
Cronbach’s Alpha
Cronbach’s Alpha based on standardized items
No of items
.914
.912
30
2.3.3 Secondary Data
The supplementary info from earlier scholars will help to support the linked data
information that will support to complete this research. Some of the secondary data
are from the literature review, journal, books and websites.
2.4 Finding and Discussion
2.4.1 Reliability Statistics
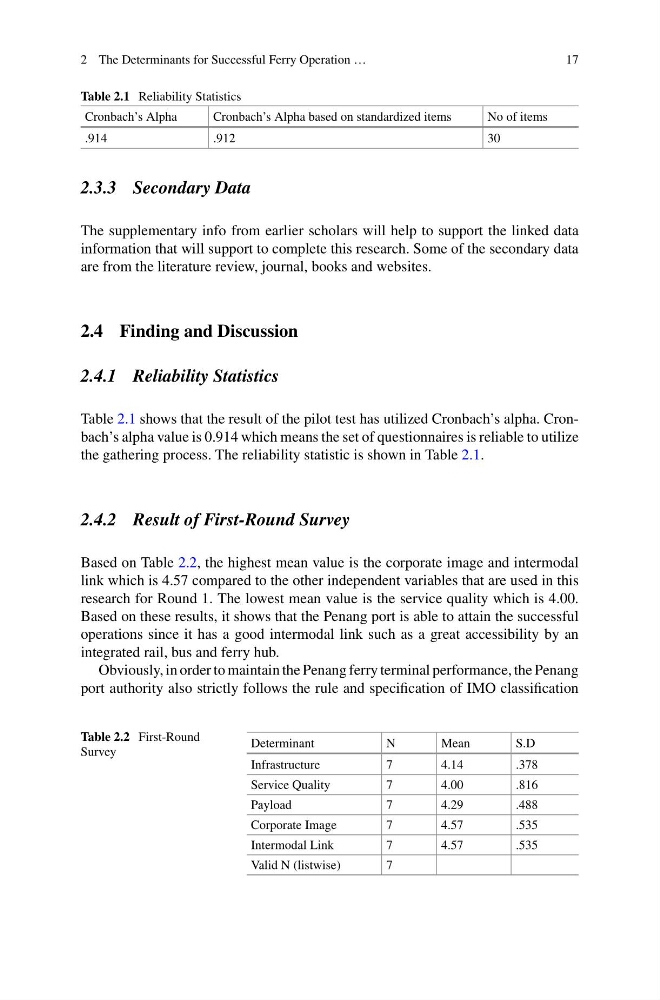
Table 2.1 shows that the result of the pilot test has utilized Cronbach’s alpha. Cronbach’s alpha value is 0.914 which means the set of questionnaires is reliable to utilize
the gathering process. The reliability statistic is shown in Table 2.1.
2.4.2 Result of First-Round Survey
Based on Table 2.2, the highest mean value is the corporate image and intermodal
link which is 4.57 compared to the other independent variables that are used in this
research for Round 1. The lowest mean value is the service quality which is 4.00.
Based on these results, it shows that the Penang port is able to attain the successful
operations since it has a good intermodal link such as a great accessibility by an
integrated rail, bus and ferry hub.
Obviously, in order to maintain the Penang ferry terminal performance, the Penang
port authority also strictly follows the rule and specification of IMO classification
Table 2.2 First-Round
Survey
Determinant
N
Mean
S.D
Infrastructure
7
4.14
.378
Service Quality
7
4.00
.816
Payload
7
4.29
.488
Corporate Image
7
4.57
.535
Intermodal Link
7
4.57
.535
Valid N (listwise)
7
17
Table 2.1 Reliability Statistics
Cronbach’s Alpha
Cronbach’s Alpha based on standardized items
No of items
.914
.912
30
2.3.3 Secondary Data
The supplementary info from earlier scholars will help to support the linked data
information that will support to complete this research. Some of the secondary data
are from the literature review, journal, books and websites.
2.4 Finding and Discussion
2.4.1 Reliability Statistics
Table 2.1 shows that the result of the pilot test has utilized Cronbach’s alpha. Cronbach’s alpha value is 0.914 which means the set of questionnaires is reliable to utilize
the gathering process. The reliability statistic is shown in Table 2.1.
2.4.2 Result of First-Round Survey
Based on Table 2.2, the highest mean value is the corporate image and intermodal
link which is 4.57 compared to the other independent variables that are used in this
research for Round 1. The lowest mean value is the service quality which is 4.00.
Based on these results, it shows that the Penang port is able to attain the successful
operations since it has a good intermodal link such as a great accessibility by an
integrated rail, bus and ferry hub.
Obviously, in order to maintain the Penang ferry terminal performance, the Penang
port authority also strictly follows the rule and specification of IMO classification
Table 2.2 First-Round
Survey
Determinant
N
Mean
S.D
Infrastructure
7
4.14
.378
Service Quality
7
4.00
.816
Payload
7
4.29
.488
Corporate Image
7
4.57
.535
Intermodal Link
7
4.57
.535
Valid N (listwise)
7