

220
M. R. Zoolfakar and M. H. A. Majid
0
5
10
15
20
25
30
35
40
12
16
20
24
Power output (mW)
Number of blades
before
free fall
aŌer
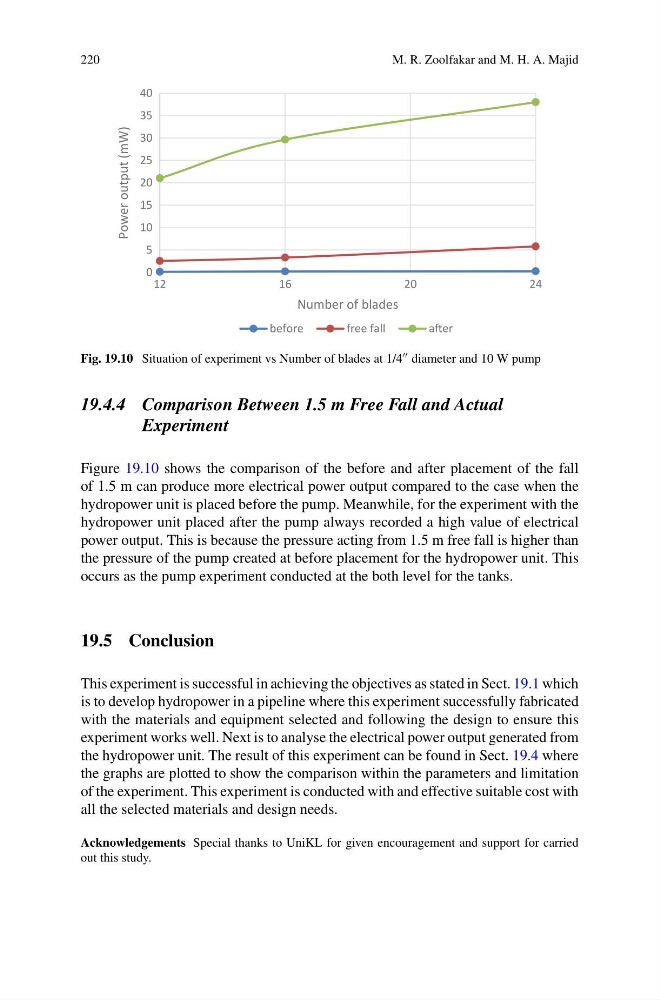
Fig. 19.10 Situation of experiment vs Number of blades at 1/4 diameter and 10 W pump
19.4.4 Comparison Between 1.5 m Free Fall and Actual
Experiment
Figure 19.10 shows the comparison of the before and after placement of the fall
of 1.5 m can produce more electrical power output compared to the case when the
hydropower unit is placed before the pump. Meanwhile, for the experiment with the
hydropower unit placed after the pump always recorded a high value of electrical
power output. This is because the pressure acting from 1.5 m free fall is higher than
the pressure of the pump created at before placement for the hydropower unit. This
occurs as the pump experiment conducted at the both level for the tanks.
19.5 Conclusion
This experiment is successful in achieving the objectives as stated in Sect. 19.1 which
is to develop hydropower in a pipeline where this experiment successfully fabricated
with the materials and equipment selected and following the design to ensure this
experiment works well. Next is to analyse the electrical power output generated from
the hydropower unit. The result of this experiment can be found in Sect. 19.4 where
the graphs are plotted to show the comparison within the parameters and limitation
of the experiment. This experiment is conducted with and effective suitable cost with
all the selected materials and design needs.
Acknowledgements Special thanks to UniKL for given encouragement and support for carried
out this study.
M. R. Zoolfakar and M. H. A. Majid
0
5
10
15
20
25
30
35
40
12
16
20
24
Power output (mW)
Number of blades
before
free fall
aŌer
Fig. 19.10 Situation of experiment vs Number of blades at 1/4 diameter and 10 W pump
19.4.4 Comparison Between 1.5 m Free Fall and Actual
Experiment
Figure 19.10 shows the comparison of the before and after placement of the fall
of 1.5 m can produce more electrical power output compared to the case when the
hydropower unit is placed before the pump. Meanwhile, for the experiment with the
hydropower unit placed after the pump always recorded a high value of electrical
power output. This is because the pressure acting from 1.5 m free fall is higher than
the pressure of the pump created at before placement for the hydropower unit. This
occurs as the pump experiment conducted at the both level for the tanks.
19.5 Conclusion
This experiment is successful in achieving the objectives as stated in Sect. 19.1 which
is to develop hydropower in a pipeline where this experiment successfully fabricated
with the materials and equipment selected and following the design to ensure this
experiment works well. Next is to analyse the electrical power output generated from
the hydropower unit. The result of this experiment can be found in Sect. 19.4 where
the graphs are plotted to show the comparison within the parameters and limitation
of the experiment. This experiment is conducted with and effective suitable cost with
all the selected materials and design needs.
Acknowledgements Special thanks to UniKL for given encouragement and support for carried
out this study.