

19 On the Hydropower Energy Generation from Pipelines
219
0.00
3.00
6.00
9.00
12.00
15.00
18.00
21.00
24.00
27.00
30.00
33.00
36.00
39.00
6
8
1 0
Output power (mW)
Power of pump (W)
12
16
24
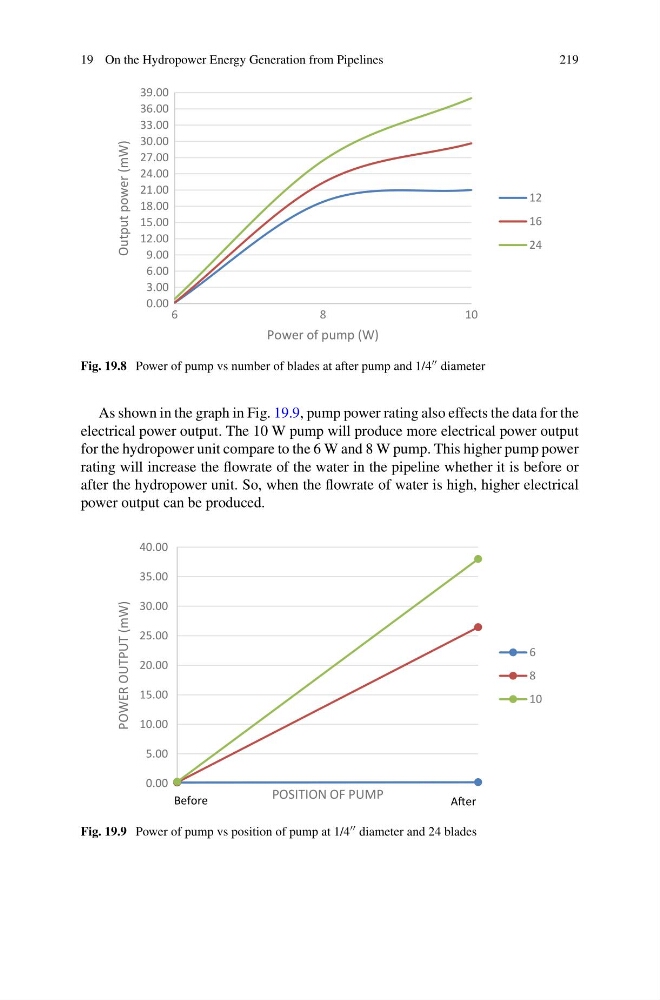
Fig. 19.8 Power of pump vs number of blades at after pump and 1/4 diameter
As shown in the graph in Fig. 19.9, pump power rating also effects the data for the
electrical power output. The 10 W pump will produce more electrical power output
for the hydropower unit compare to the 6 W and 8 W pump. This higher pump power
rating will increase the flowrate of the water in the pipeline whether it is before or
after the hydropower unit. So, when the flowrate of water is high, higher electrical
power output can be produced.
0.00
5.00
10.00
15.00
20.00
25.00
30.00
35.00
40.00
POWER OUTPUT (mW)
POSITION OF PUMP
6
8
10
AŌer
Before
Fig. 19.9 Power of pump vs position of pump at 1/4 diameter and 24 blades
219
0.00
3.00
6.00
9.00
12.00
15.00
18.00
21.00
24.00
27.00
30.00
33.00
36.00
39.00
6
8
1 0
Output power (mW)
Power of pump (W)
12
16
24
Fig. 19.8 Power of pump vs number of blades at after pump and 1/4 diameter
As shown in the graph in Fig. 19.9, pump power rating also effects the data for the
electrical power output. The 10 W pump will produce more electrical power output
for the hydropower unit compare to the 6 W and 8 W pump. This higher pump power
rating will increase the flowrate of the water in the pipeline whether it is before or
after the hydropower unit. So, when the flowrate of water is high, higher electrical
power output can be produced.
0.00
5.00
10.00
15.00
20.00
25.00
30.00
35.00
40.00
POWER OUTPUT (mW)
POSITION OF PUMP
6
8
10
AŌer
Before
Fig. 19.9 Power of pump vs position of pump at 1/4 diameter and 24 blades