

18 A Water Hyacinth Harvester
205
Table 18.4 Propeller
analysis results
Distance (m)
Propellers
Propeller 1
Propeller 2
Propeller 3
1
12.04
9.25
7.14
2
24.96
18.4
14.06
3
36.84
27.72
21.3
4
47.96
37.12
28.52
5
60.72
46.24
34.93
6
72.44
55.48
42.52
7
84.5
64.7
49.9
8
96.3
74.06
57.12
9
108.62
83.15
64.23
10
120.56
92.14
71.6
• Lastly, propeller blades number 2 were removed and propeller blades number 3
were added, tighten with the plastic straps and the same procedure was done again
and time was recorded.
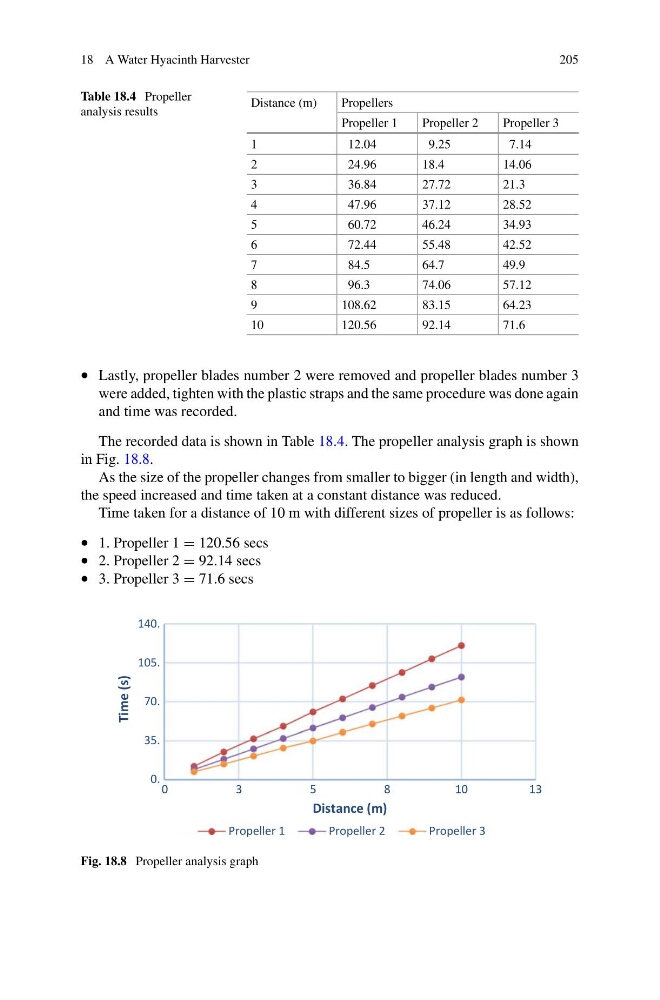
The recorded data is shown in Table 18.4. The propeller analysis graph is shown
in Fig. 18.8.
As the size of the propeller changes from smaller to bigger (in length and width),
the speed increased and time taken at a constant distance was reduced.
Time taken for a distance of 10 m with different sizes of propeller is as follows:
• 1. Propeller 1 = 120.56 secs
• 2. Propeller 2 = 92.14 secs
• 3. Propeller 3 = 71.6 secs
0.
35.
70.
105.
140.
0
3
5
8
1 0
1 3
Time (s)
Distance (m)
Propeller 1
Propeller 2
Propeller 3
Fig. 18.8 Propeller analysis graph
205
Table 18.4 Propeller
analysis results
Distance (m)
Propellers
Propeller 1
Propeller 2
Propeller 3
1
12.04
9.25
7.14
2
24.96
18.4
14.06
3
36.84
27.72
21.3
4
47.96
37.12
28.52
5
60.72
46.24
34.93
6
72.44
55.48
42.52
7
84.5
64.7
49.9
8
96.3
74.06
57.12
9
108.62
83.15
64.23
10
120.56
92.14
71.6
• Lastly, propeller blades number 2 were removed and propeller blades number 3
were added, tighten with the plastic straps and the same procedure was done again
and time was recorded.
The recorded data is shown in Table 18.4. The propeller analysis graph is shown
in Fig. 18.8.
As the size of the propeller changes from smaller to bigger (in length and width),
the speed increased and time taken at a constant distance was reduced.
Time taken for a distance of 10 m with different sizes of propeller is as follows:
• 1. Propeller 1 = 120.56 secs
• 2. Propeller 2 = 92.14 secs
• 3. Propeller 3 = 71.6 secs
0.
35.
70.
105.
140.
0
3
5
8
1 0
1 3
Time (s)
Distance (m)
Propeller 1
Propeller 2
Propeller 3
Fig. 18.8 Propeller analysis graph