

152
W. M. Dahalan et al.
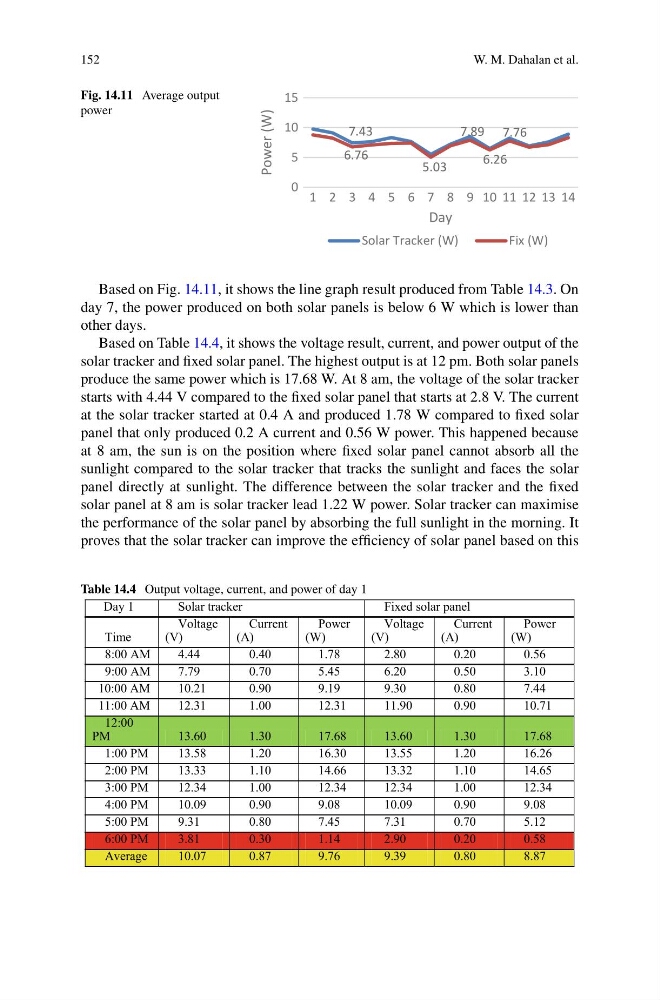
Fig. 14.11 Average output
power
7.43
6.76
5.03
7.89
6.26
7.76
0
5
10
15
1 2 3 4 5 6 7 8 9 10 11 12 13 14
Power (W)
Day
Solar Tracker (W)
Fix (W)
Based on Fig. 14.11, it shows the line graph result produced from Table 14.3. On
day 7, the power produced on both solar panels is below 6 W which is lower than
other days.
Based on Table 14.4, it shows the voltage result, current, and power output of the
solar tracker and fixed solar panel. The highest output is at 12 pm. Both solar panels
produce the same power which is 17.68 W. At 8 am, the voltage of the solar tracker
starts with 4.44 V compared to the fixed solar panel that starts at 2.8 V. The current
at the solar tracker started at 0.4 A and produced 1.78 W compared to fixed solar
panel that only produced 0.2 A current and 0.56 W power. This happened because
at 8 am, the sun is on the position where fixed solar panel cannot absorb all the
sunlight compared to the solar tracker that tracks the sunlight and faces the solar
panel directly at sunlight. The difference between the solar tracker and the fixed
solar panel at 8 am is solar tracker lead 1.22 W power. Solar tracker can maximise
the performance of the solar panel by absorbing the full sunlight in the morning. It
proves that the solar tracker can improve the efficiency of solar panel based on this
Table 14.4 Output voltage, current, and power of day 1
Day 1
Solar tracker
Fixed solar panel
Time
Voltage
(V)
Current
(A)
Power
(W)
Voltage
(V)
Current
(A)
Power
(W)
8:00 AM
4.44
0.40
1.78
2.80
0.20
0.56
9:00 AM
7.79
0.70
5.45
6.20
0.50
3.10
10:00 AM
10.21
0.90
9.19
9.30
0.80
7.44
11:00 AM
12.31
1.00
12.31
11.90
0.90
10.71
12:00
PM
13.60
1.30
17.68
13.60
1.30
17.68
1:00 PM
13.58
1.20
16.30
13.55
1.20
16.26
2:00 PM
13.33
1.10
14.66
13.32
1.10
14.65
3:00 PM
12.34
1.00
12.34
12.34
1.00
12.34
4:00 PM
10.09
0.90
9.08
10.09
0.90
9.08
5:00 PM
9.31
0.80
7.45
7.31
0.70
5.12
6:00 PM
3.81
0.30
1.14
2.90
0.20
0.58
Average
10.07
0.87
9.76
9.39
0.80
8.87
W. M. Dahalan et al.
Fig. 14.11 Average output
power
7.43
6.76
5.03
7.89
6.26
7.76
0
5
10
15
1 2 3 4 5 6 7 8 9 10 11 12 13 14
Power (W)
Day
Solar Tracker (W)
Fix (W)
Based on Fig. 14.11, it shows the line graph result produced from Table 14.3. On
day 7, the power produced on both solar panels is below 6 W which is lower than
other days.
Based on Table 14.4, it shows the voltage result, current, and power output of the
solar tracker and fixed solar panel. The highest output is at 12 pm. Both solar panels
produce the same power which is 17.68 W. At 8 am, the voltage of the solar tracker
starts with 4.44 V compared to the fixed solar panel that starts at 2.8 V. The current
at the solar tracker started at 0.4 A and produced 1.78 W compared to fixed solar
panel that only produced 0.2 A current and 0.56 W power. This happened because
at 8 am, the sun is on the position where fixed solar panel cannot absorb all the
sunlight compared to the solar tracker that tracks the sunlight and faces the solar
panel directly at sunlight. The difference between the solar tracker and the fixed
solar panel at 8 am is solar tracker lead 1.22 W power. Solar tracker can maximise
the performance of the solar panel by absorbing the full sunlight in the morning. It
proves that the solar tracker can improve the efficiency of solar panel based on this
Table 14.4 Output voltage, current, and power of day 1
Day 1
Solar tracker
Fixed solar panel
Time
Voltage
(V)
Current
(A)
Power
(W)
Voltage
(V)
Current
(A)
Power
(W)
8:00 AM
4.44
0.40
1.78
2.80
0.20
0.56
9:00 AM
7.79
0.70
5.45
6.20
0.50
3.10
10:00 AM
10.21
0.90
9.19
9.30
0.80
7.44
11:00 AM
12.31
1.00
12.31
11.90
0.90
10.71
12:00
PM
13.60
1.30
17.68
13.60
1.30
17.68
1:00 PM
13.58
1.20
16.30
13.55
1.20
16.26
2:00 PM
13.33
1.10
14.66
13.32
1.10
14.65
3:00 PM
12.34
1.00
12.34
12.34
1.00
12.34
4:00 PM
10.09
0.90
9.08
10.09
0.90
9.08
5:00 PM
9.31
0.80
7.45
7.31
0.70
5.12
6:00 PM
3.81
0.30
1.14
2.90
0.20
0.58
Average
10.07
0.87
9.76
9.39
0.80
8.87