

14 Development of a Solar Tracker …
151
current produced is almost the same value due to overcasting and raining weather
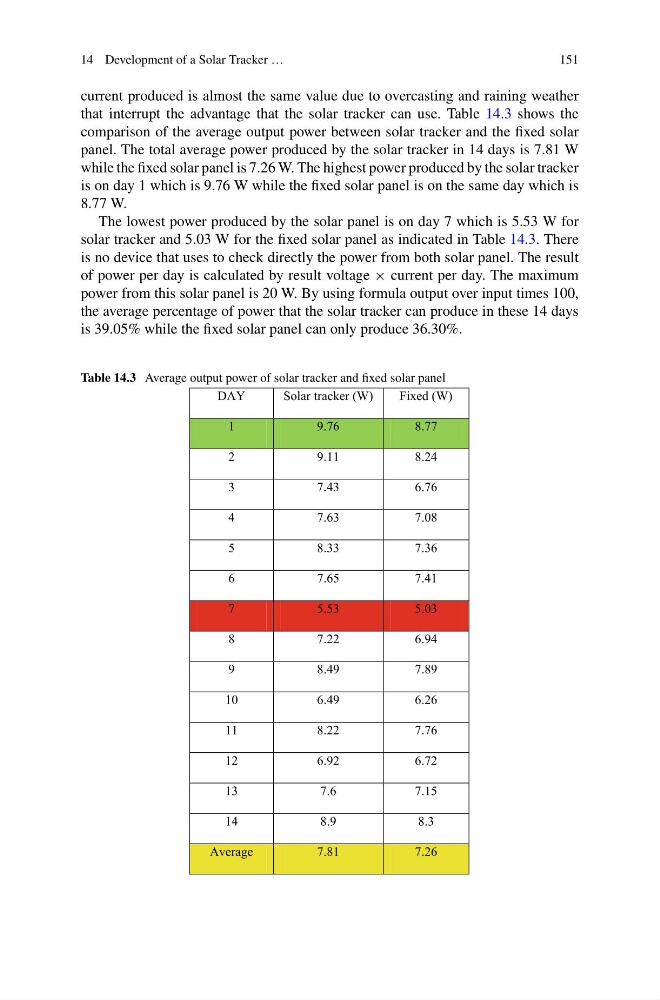
that interrupt the advantage that the solar tracker can use. Table 14.3 shows the
comparison of the average output power between solar tracker and the fixed solar
panel. The total average power produced by the solar tracker in 14 days is 7.81 W
while the fixed solar panel is 7.26 W. The highest power produced by the solar tracker
is on day 1 which is 9.76 W while the fixed solar panel is on the same day which is
8.77 W.
The lowest power produced by the solar panel is on day 7 which is 5.53 W for
solar tracker and 5.03 W for the fixed solar panel as indicated in Table 14.3. There
is no device that uses to check directly the power from both solar panel. The result
of power per day is calculated by result voltage × current per day. The maximum
power from this solar panel is 20 W. By using formula output over input times 100,
the average percentage of power that the solar tracker can produce in these 14 days
is 39.05% while the fixed solar panel can only produce 36.30%.
Table 14.3 Average output power of solar tracker and fixed solar panel
DAY
Solar tracker (W)
Fixed (W)
1
9.76
8.77
2
9.11
8.24
3
7.43
6.76
4
7.63
7.08
5
8.33
7.36
6
7.65
7.41
7
5.53
5.03
8
7.22
6.94
9
8.49
7.89
10
6.49
6.26
11
8.22
7.76
12
6.92
6.72
13
7.6
7.15
14
8.9
8.3
Average
7.81
7.26
151
current produced is almost the same value due to overcasting and raining weather
that interrupt the advantage that the solar tracker can use. Table 14.3 shows the
comparison of the average output power between solar tracker and the fixed solar
panel. The total average power produced by the solar tracker in 14 days is 7.81 W
while the fixed solar panel is 7.26 W. The highest power produced by the solar tracker
is on day 1 which is 9.76 W while the fixed solar panel is on the same day which is
8.77 W.
The lowest power produced by the solar panel is on day 7 which is 5.53 W for
solar tracker and 5.03 W for the fixed solar panel as indicated in Table 14.3. There
is no device that uses to check directly the power from both solar panel. The result
of power per day is calculated by result voltage × current per day. The maximum
power from this solar panel is 20 W. By using formula output over input times 100,
the average percentage of power that the solar tracker can produce in these 14 days
is 39.05% while the fixed solar panel can only produce 36.30%.
Table 14.3 Average output power of solar tracker and fixed solar panel
DAY
Solar tracker (W)
Fixed (W)
1
9.76
8.77
2
9.11
8.24
3
7.43
6.76
4
7.63
7.08
5
8.33
7.36
6
7.65
7.41
7
5.53
5.03
8
7.22
6.94
9
8.49
7.89
10
6.49
6.26
11
8.22
7.76
12
6.92
6.72
13
7.6
7.15
14
8.9
8.3
Average
7.81
7.26