

14 Development of a Solar Tracker …
149
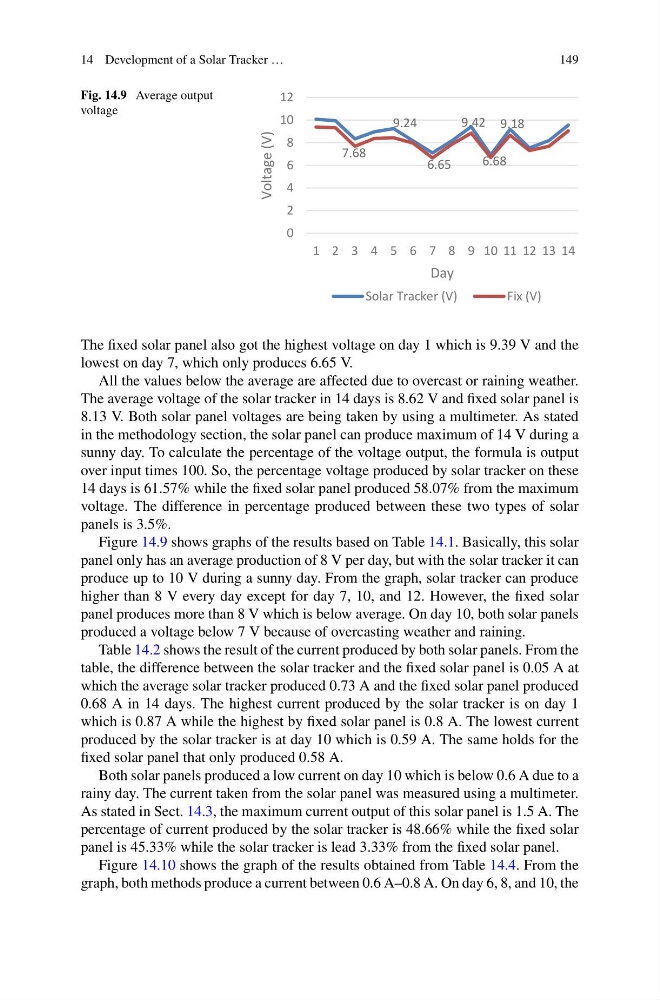
Fig. 14.9 Average output
voltage
9.24
9.42 9.18
7.68
6.65
6.68
0
2
4
6
8
10
12
1 2 3 4 5 6 7 8 9 10 11 12 13 14
Voltage (V)
Day
Solar Tracker (V)
Fix (V)
The fixed solar panel also got the highest voltage on day 1 which is 9.39 V and the
lowest on day 7, which only produces 6.65 V.
All the values below the average are affected due to overcast or raining weather.
The average voltage of the solar tracker in 14 days is 8.62 V and fixed solar panel is
8.13 V. Both solar panel voltages are being taken by using a multimeter. As stated
in the methodology section, the solar panel can produce maximum of 14 V during a
sunny day. To calculate the percentage of the voltage output, the formula is output
over input times 100. So, the percentage voltage produced by solar tracker on these
14 days is 61.57% while the fixed solar panel produced 58.07% from the maximum
voltage. The difference in percentage produced between these two types of solar
panels is 3.5%.
Figure 14.9 shows graphs of the results based on Table 14.1. Basically, this solar
panel only has an average production of 8 V per day, but with the solar tracker it can
produce up to 10 V during a sunny day. From the graph, solar tracker can produce
higher than 8 V every day except for day 7, 10, and 12. However, the fixed solar
panel produces more than 8 V which is below average. On day 10, both solar panels
produced a voltage below 7 V because of overcasting weather and raining.
Table 14.2 shows the result of the current produced by both solar panels. From the
table, the difference between the solar tracker and the fixed solar panel is 0.05 A at
which the average solar tracker produced 0.73 A and the fixed solar panel produced
0.68 A in 14 days. The highest current produced by the solar tracker is on day 1
which is 0.87 A while the highest by fixed solar panel is 0.8 A. The lowest current
produced by the solar tracker is at day 10 which is 0.59 A. The same holds for the
fixed solar panel that only produced 0.58 A.
Both solar panels produced a low current on day 10 which is below 0.6 A due to a
rainy day. The current taken from the solar panel was measured using a multimeter.
As stated in Sect. 14.3, the maximum current output of this solar panel is 1.5 A. The
percentage of current produced by the solar tracker is 48.66% while the fixed solar
panel is 45.33% while the solar tracker is lead 3.33% from the fixed solar panel.
Figure 14.10 shows the graph of the results obtained from Table 14.4. From the
graph, both methods produce a current between 0.6 A–0.8 A. On day 6, 8, and 10, the
149
Fig. 14.9 Average output
voltage
9.24
9.42 9.18
7.68
6.65
6.68
0
2
4
6
8
10
12
1 2 3 4 5 6 7 8 9 10 11 12 13 14
Voltage (V)
Day
Solar Tracker (V)
Fix (V)
The fixed solar panel also got the highest voltage on day 1 which is 9.39 V and the
lowest on day 7, which only produces 6.65 V.
All the values below the average are affected due to overcast or raining weather.
The average voltage of the solar tracker in 14 days is 8.62 V and fixed solar panel is
8.13 V. Both solar panel voltages are being taken by using a multimeter. As stated
in the methodology section, the solar panel can produce maximum of 14 V during a
sunny day. To calculate the percentage of the voltage output, the formula is output
over input times 100. So, the percentage voltage produced by solar tracker on these
14 days is 61.57% while the fixed solar panel produced 58.07% from the maximum
voltage. The difference in percentage produced between these two types of solar
panels is 3.5%.
Figure 14.9 shows graphs of the results based on Table 14.1. Basically, this solar
panel only has an average production of 8 V per day, but with the solar tracker it can
produce up to 10 V during a sunny day. From the graph, solar tracker can produce
higher than 8 V every day except for day 7, 10, and 12. However, the fixed solar
panel produces more than 8 V which is below average. On day 10, both solar panels
produced a voltage below 7 V because of overcasting weather and raining.
Table 14.2 shows the result of the current produced by both solar panels. From the
table, the difference between the solar tracker and the fixed solar panel is 0.05 A at
which the average solar tracker produced 0.73 A and the fixed solar panel produced
0.68 A in 14 days. The highest current produced by the solar tracker is on day 1
which is 0.87 A while the highest by fixed solar panel is 0.8 A. The lowest current
produced by the solar tracker is at day 10 which is 0.59 A. The same holds for the
fixed solar panel that only produced 0.58 A.
Both solar panels produced a low current on day 10 which is below 0.6 A due to a
rainy day. The current taken from the solar panel was measured using a multimeter.
As stated in Sect. 14.3, the maximum current output of this solar panel is 1.5 A. The
percentage of current produced by the solar tracker is 48.66% while the fixed solar
panel is 45.33% while the solar tracker is lead 3.33% from the fixed solar panel.
Figure 14.10 shows the graph of the results obtained from Table 14.4. From the
graph, both methods produce a current between 0.6 A–0.8 A. On day 6, 8, and 10, the