

148
W. M. Dahalan et al.
All performance data are set by coding in the Arduino Uno which acts as a
mother controller of this project. By using the four-quadrant LDR concept on the
solar tracker, each LDR will compare the intensity of the light and will give the
data to the Arduino. In the coding of the Arduino, each intensity level will move a
minimum of 20 degree and a maximum of 270 degrees. The speed of the servo motor
is 0.14 s/60 degree at a supply of 4.8 V. But due to some load on the servo motor, the
speed has been reduced a little bit. The movement performance of this solar tracker is
not very smooth and has a small delay when changing the movement. As an example,
from north to south there is 0.2–0.8 s delay when changing the position. Some LDRs
do not track the light properly if the light is too close to the LDR. As the result, the
solar panel sometimes will move choppily.
The third objective of this project is to record and compare the voltage, current,
and power output between the solar tracker and fixed solar panel. All data have been
recorded in the table for two consecutive weeks. The data are recorded from 8 am to
6 pm every day and the data are used to calculate the average output power produced
and the percentage of difference between the solar tracker and the fixed solar panel.
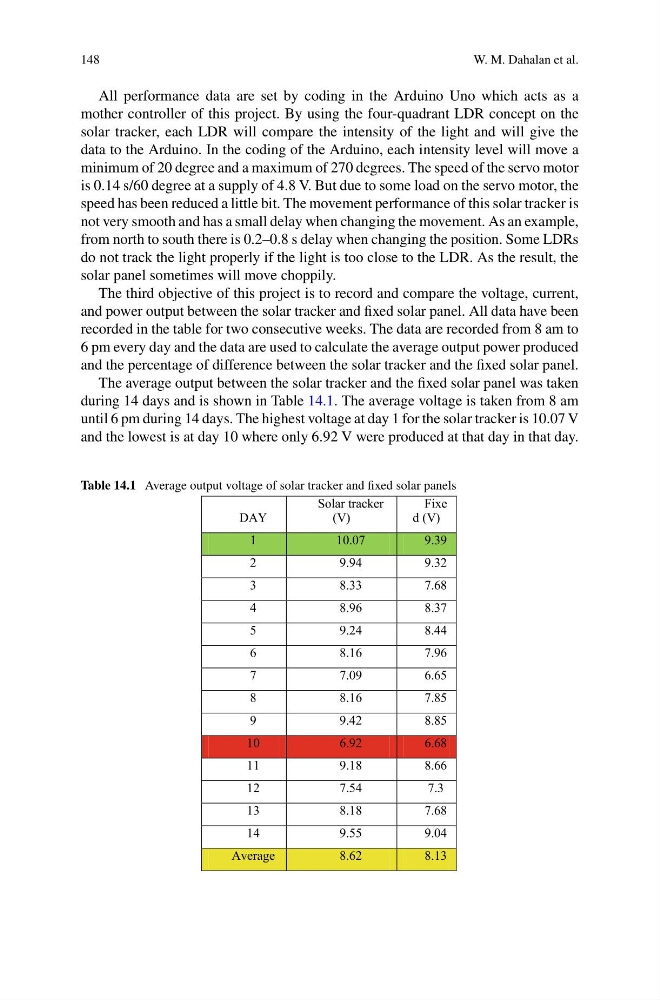
The average output between the solar tracker and the fixed solar panel was taken
during 14 days and is shown in Table 14.1. The average voltage is taken from 8 am
until 6 pm during 14 days. The highest voltage at day 1 for the solar tracker is 10.07 V
and the lowest is at day 10 where only 6.92 V were produced at that day in that day.
Table 14.1 Average output voltage of solar tracker and fixed solar panels
DAY
Solar tracker
(V)
Fixe
d (V)
1
10.07
9.39
2
9.94
9.32
3
8.33
7.68
4
8.96
8.37
5
9.24
8.44
6
8.16
7.96
7
7.09
6.65
8
8.16
7.85
9
9.42
8.85
10
6.92
6.68
11
9.18
8.66
12
7.54
7.3
13
8.18
7.68
14
9.55
9.04
Average
8.62
8.13
W. M. Dahalan et al.
All performance data are set by coding in the Arduino Uno which acts as a
mother controller of this project. By using the four-quadrant LDR concept on the
solar tracker, each LDR will compare the intensity of the light and will give the
data to the Arduino. In the coding of the Arduino, each intensity level will move a
minimum of 20 degree and a maximum of 270 degrees. The speed of the servo motor
is 0.14 s/60 degree at a supply of 4.8 V. But due to some load on the servo motor, the
speed has been reduced a little bit. The movement performance of this solar tracker is
not very smooth and has a small delay when changing the movement. As an example,
from north to south there is 0.2–0.8 s delay when changing the position. Some LDRs
do not track the light properly if the light is too close to the LDR. As the result, the
solar panel sometimes will move choppily.
The third objective of this project is to record and compare the voltage, current,
and power output between the solar tracker and fixed solar panel. All data have been
recorded in the table for two consecutive weeks. The data are recorded from 8 am to
6 pm every day and the data are used to calculate the average output power produced
and the percentage of difference between the solar tracker and the fixed solar panel.
The average output between the solar tracker and the fixed solar panel was taken
during 14 days and is shown in Table 14.1. The average voltage is taken from 8 am
until 6 pm during 14 days. The highest voltage at day 1 for the solar tracker is 10.07 V
and the lowest is at day 10 where only 6.92 V were produced at that day in that day.
Table 14.1 Average output voltage of solar tracker and fixed solar panels
DAY
Solar tracker
(V)
Fixe
d (V)
1
10.07
9.39
2
9.94
9.32
3
8.33
7.68
4
8.96
8.37
5
9.24
8.44
6
8.16
7.96
7
7.09
6.65
8
8.16
7.85
9
9.42
8.85
10
6.92
6.68
11
9.18
8.66
12
7.54
7.3
13
8.18
7.68
14
9.55
9.04
Average
8.62
8.13