

12 Optimization of Route Selection …
125
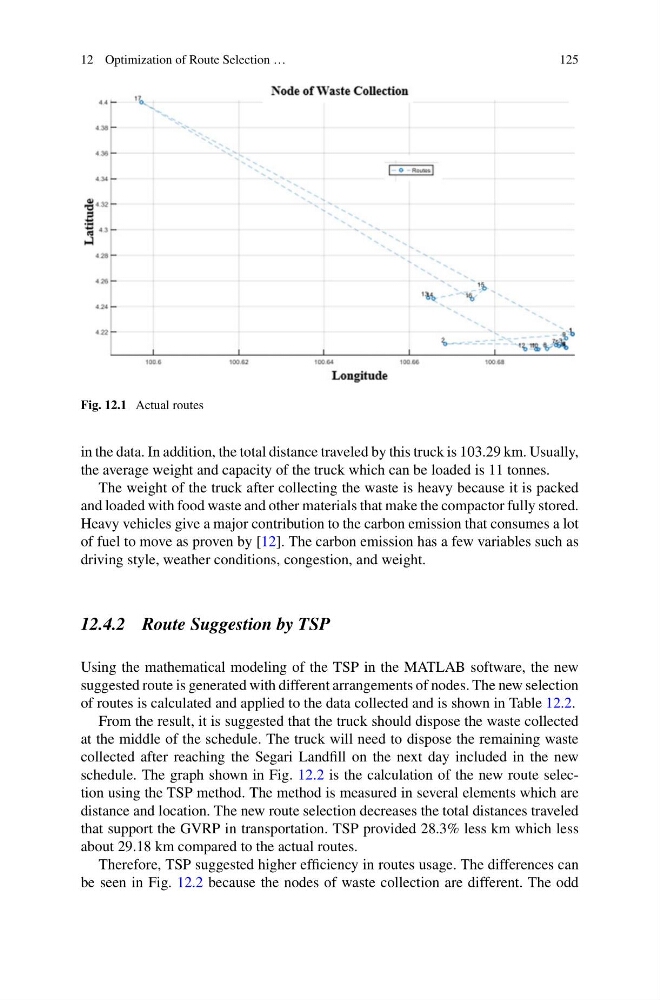
Fig. 12.1 Actual routes
in the data. In addition, the total distance traveled by this truck is 103.29 km. Usually,
the average weight and capacity of the truck which can be loaded is 11 tonnes.
The weight of the truck after collecting the waste is heavy because it is packed
and loaded with food waste and other materials that make the compactor fully stored.
Heavy vehicles give a major contribution to the carbon emission that consumes a lot
of fuel to move as proven by [12]. The carbon emission has a few variables such as
driving style, weather conditions, congestion, and weight.
12.4.2 Route Suggestion by TSP
Using the mathematical modeling of the TSP in the MATLAB software, the new
suggested route is generated with different arrangements of nodes. The new selection
of routes is calculated and applied to the data collected and is shown in Table 12.2.
From the result, it is suggested that the truck should dispose the waste collected
at the middle of the schedule. The truck will need to dispose the remaining waste
collected after reaching the Segari Landfill on the next day included in the new
schedule. The graph shown in Fig. 12.2 is the calculation of the new route selection using the TSP method. The method is measured in several elements which are
distance and location. The new route selection decreases the total distances traveled
that support the GVRP in transportation. TSP provided 28.3% less km which less
about 29.18 km compared to the actual routes.
Therefore, TSP suggested higher efficiency in routes usage. The differences can
be seen in Fig. 12.2 because the nodes of waste collection are different. The odd
125
Fig. 12.1 Actual routes
in the data. In addition, the total distance traveled by this truck is 103.29 km. Usually,
the average weight and capacity of the truck which can be loaded is 11 tonnes.
The weight of the truck after collecting the waste is heavy because it is packed
and loaded with food waste and other materials that make the compactor fully stored.
Heavy vehicles give a major contribution to the carbon emission that consumes a lot
of fuel to move as proven by [12]. The carbon emission has a few variables such as
driving style, weather conditions, congestion, and weight.
12.4.2 Route Suggestion by TSP
Using the mathematical modeling of the TSP in the MATLAB software, the new
suggested route is generated with different arrangements of nodes. The new selection
of routes is calculated and applied to the data collected and is shown in Table 12.2.
From the result, it is suggested that the truck should dispose the waste collected
at the middle of the schedule. The truck will need to dispose the remaining waste
collected after reaching the Segari Landfill on the next day included in the new
schedule. The graph shown in Fig. 12.2 is the calculation of the new route selection using the TSP method. The method is measured in several elements which are
distance and location. The new route selection decreases the total distances traveled
that support the GVRP in transportation. TSP provided 28.3% less km which less
about 29.18 km compared to the actual routes.
Therefore, TSP suggested higher efficiency in routes usage. The differences can
be seen in Fig. 12.2 because the nodes of waste collection are different. The odd