

Statistical Optimization of Ammonium Sulfamate and Urea-Based Fire …
117
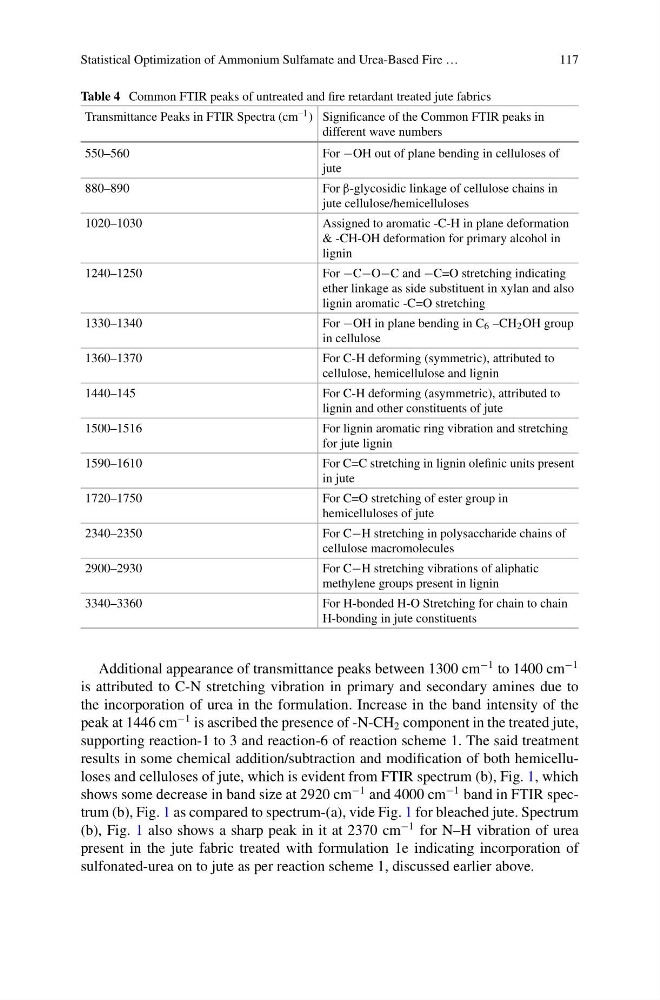
Table 4 Common FTIR peaks of untreated and fire retardant treated jute fabrics
Transmittance Peaks in FTIR Spectra (cm –1 ) Significance of the Common FTIR peaks in
different wave numbers
550–560
For −OH out of plane bending in celluloses of
jute
880–890
For β-glycosidic linkage of cellulose chains in
jute cellulose/hemicelluloses
1020–1030
Assigned to aromatic -C-H in plane deformation
& -CH-OH deformation for primary alcohol in
lignin
1240–1250
For −C−O−C and −C=O stretching indicating
ether linkage as side substituent in xylan and also
lignin aromatic -C=O stretching
1330–1340
For −OH in plane bending in C 6 –CH 2 OH group
in cellulose
1360–1370
For C-H deforming (symmetric), attributed to
cellulose, hemicellulose and lignin
1440–145
For C-H deforming (asymmetric), attributed to
lignin and other constituents of jute
1500–1516
For lignin aromatic ring vibration and stretching
for jute lignin
1590–1610
For C=C stretching in lignin olefinic units present
in jute
1720–1750
For C=O stretching of ester group in
hemicelluloses of jute
2340–2350
For C−H stretching in polysaccharide chains of
cellulose macromolecules
2900–2930
For C−H stretching vibrations of aliphatic
methylene groups present in lignin
3340–3360
For H-bonded H-O Stretching for chain to chain
H-bonding in jute constituents
Additional appearance of transmittance peaks between 1300 cm
−1 to 1400 cm
−1
is attributed to C-N stretching vibration in primary and secondary amines due to
the incorporation of urea in the formulation. Increase in the band intensity of the
peak at 1446 cm
−1 is ascribed the presence of -N-CH 2 component in the treated jute,
supporting reaction-1 to 3 and reaction-6 of reaction scheme 1. The said treatment
results in some chemical addition/subtraction and modification of both hemicelluloses and celluloses of jute, which is evident from FTIR spectrum (b), Fig. 1, which
shows some decrease in band size at 2920 cm
−1 and 4000 cm
−1 band in FTIR spectrum (b), Fig. 1 as compared to spectrum-(a), vide Fig. 1 for bleached jute. Spectrum
(b), Fig. 1 also shows a sharp peak in it at 2370 cm
−1 for N–H vibration of urea
present in the jute fabric treated with formulation 1e indicating incorporation of
sulfonated-urea on to jute as per reaction scheme 1, discussed earlier above.
117
Table 4 Common FTIR peaks of untreated and fire retardant treated jute fabrics
Transmittance Peaks in FTIR Spectra (cm –1 ) Significance of the Common FTIR peaks in
different wave numbers
550–560
For −OH out of plane bending in celluloses of
jute
880–890
For β-glycosidic linkage of cellulose chains in
jute cellulose/hemicelluloses
1020–1030
Assigned to aromatic -C-H in plane deformation
& -CH-OH deformation for primary alcohol in
lignin
1240–1250
For −C−O−C and −C=O stretching indicating
ether linkage as side substituent in xylan and also
lignin aromatic -C=O stretching
1330–1340
For −OH in plane bending in C 6 –CH 2 OH group
in cellulose
1360–1370
For C-H deforming (symmetric), attributed to
cellulose, hemicellulose and lignin
1440–145
For C-H deforming (asymmetric), attributed to
lignin and other constituents of jute
1500–1516
For lignin aromatic ring vibration and stretching
for jute lignin
1590–1610
For C=C stretching in lignin olefinic units present
in jute
1720–1750
For C=O stretching of ester group in
hemicelluloses of jute
2340–2350
For C−H stretching in polysaccharide chains of
cellulose macromolecules
2900–2930
For C−H stretching vibrations of aliphatic
methylene groups present in lignin
3340–3360
For H-bonded H-O Stretching for chain to chain
H-bonding in jute constituents
Additional appearance of transmittance peaks between 1300 cm
−1 to 1400 cm
−1
is attributed to C-N stretching vibration in primary and secondary amines due to
the incorporation of urea in the formulation. Increase in the band intensity of the
peak at 1446 cm
−1 is ascribed the presence of -N-CH 2 component in the treated jute,
supporting reaction-1 to 3 and reaction-6 of reaction scheme 1. The said treatment
results in some chemical addition/subtraction and modification of both hemicelluloses and celluloses of jute, which is evident from FTIR spectrum (b), Fig. 1, which
shows some decrease in band size at 2920 cm
−1 and 4000 cm
−1 band in FTIR spectrum (b), Fig. 1 as compared to spectrum-(a), vide Fig. 1 for bleached jute. Spectrum
(b), Fig. 1 also shows a sharp peak in it at 2370 cm
−1 for N–H vibration of urea
present in the jute fabric treated with formulation 1e indicating incorporation of
sulfonated-urea on to jute as per reaction scheme 1, discussed earlier above.