

88
V. Sisodia et al.
Root Mean Squared Error (RMSE) =
n
i=1 (x i − x o )
2
n
(1)
where x i = target value; x o = observed value and n = number of observations.
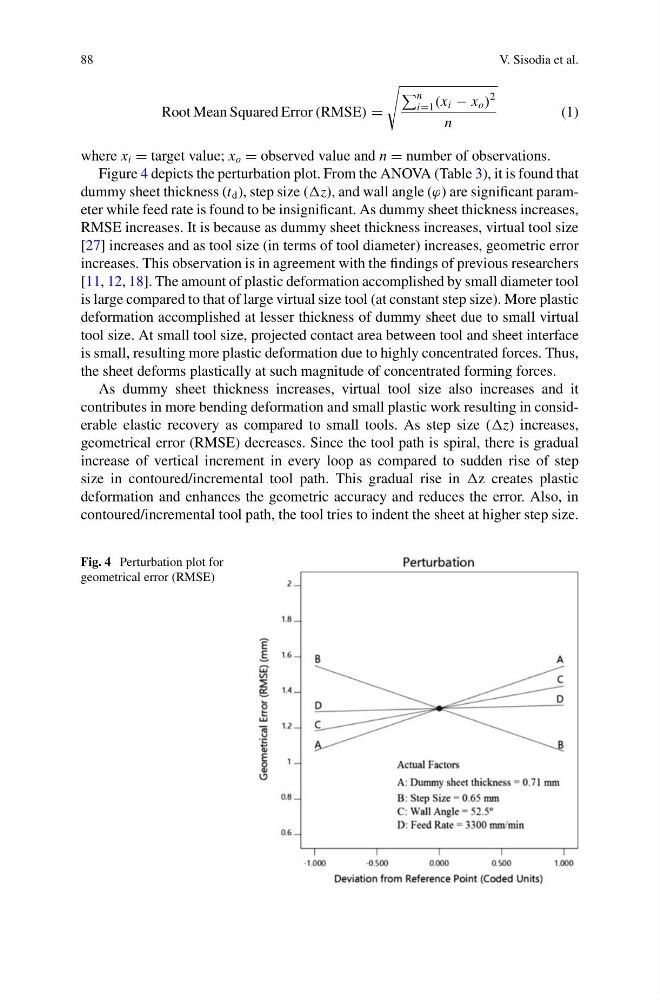
Figure 4 depicts the perturbation plot. From the ANOVA (Table 3), it is found that
dummy sheet thickness (t d ), step size (z), and wall angle (ϕ) are significant parameter while feed rate is found to be insignificant. As dummy sheet thickness increases,
RMSE increases. It is because as dummy sheet thickness increases, virtual tool size
[27] increases and as tool size (in terms of tool diameter) increases, geometric error
increases. This observation is in agreement with the findings of previous researchers
[11, 12, 18]. The amount of plastic deformation accomplished by small diameter tool
is large compared to that of large virtual size tool (at constant step size). More plastic
deformation accomplished at lesser thickness of dummy sheet due to small virtual
tool size. At small tool size, projected contact area between tool and sheet interface
is small, resulting more plastic deformation due to highly concentrated forces. Thus,
the sheet deforms plastically at such magnitude of concentrated forming forces.
As dummy sheet thickness increases, virtual tool size also increases and it
contributes in more bending deformation and small plastic work resulting in considerable elastic recovery as compared to small tools. As step size (z) increases,
geometrical error (RMSE) decreases. Since the tool path is spiral, there is gradual
increase of vertical increment in every loop as compared to sudden rise of step
size in contoured/incremental tool path. This gradual rise in z creates plastic
deformation and enhances the geometric accuracy and reduces the error. Also, in
contoured/incremental tool path, the tool tries to indent the sheet at higher step size.
Fig. 4 Perturbation plot for
geometrical error (RMSE)
V. Sisodia et al.
Root Mean Squared Error (RMSE) =
n
i=1 (x i − x o )
2
n
(1)
where x i = target value; x o = observed value and n = number of observations.
Figure 4 depicts the perturbation plot. From the ANOVA (Table 3), it is found that
dummy sheet thickness (t d ), step size (z), and wall angle (ϕ) are significant parameter while feed rate is found to be insignificant. As dummy sheet thickness increases,
RMSE increases. It is because as dummy sheet thickness increases, virtual tool size
[27] increases and as tool size (in terms of tool diameter) increases, geometric error
increases. This observation is in agreement with the findings of previous researchers
[11, 12, 18]. The amount of plastic deformation accomplished by small diameter tool
is large compared to that of large virtual size tool (at constant step size). More plastic
deformation accomplished at lesser thickness of dummy sheet due to small virtual
tool size. At small tool size, projected contact area between tool and sheet interface
is small, resulting more plastic deformation due to highly concentrated forces. Thus,
the sheet deforms plastically at such magnitude of concentrated forming forces.
As dummy sheet thickness increases, virtual tool size also increases and it
contributes in more bending deformation and small plastic work resulting in considerable elastic recovery as compared to small tools. As step size (z) increases,
geometrical error (RMSE) decreases. Since the tool path is spiral, there is gradual
increase of vertical increment in every loop as compared to sudden rise of step
size in contoured/incremental tool path. This gradual rise in z creates plastic
deformation and enhances the geometric accuracy and reduces the error. Also, in
contoured/incremental tool path, the tool tries to indent the sheet at higher step size.
Fig. 4 Perturbation plot for
geometrical error (RMSE)