

58
M. Saleem et al.
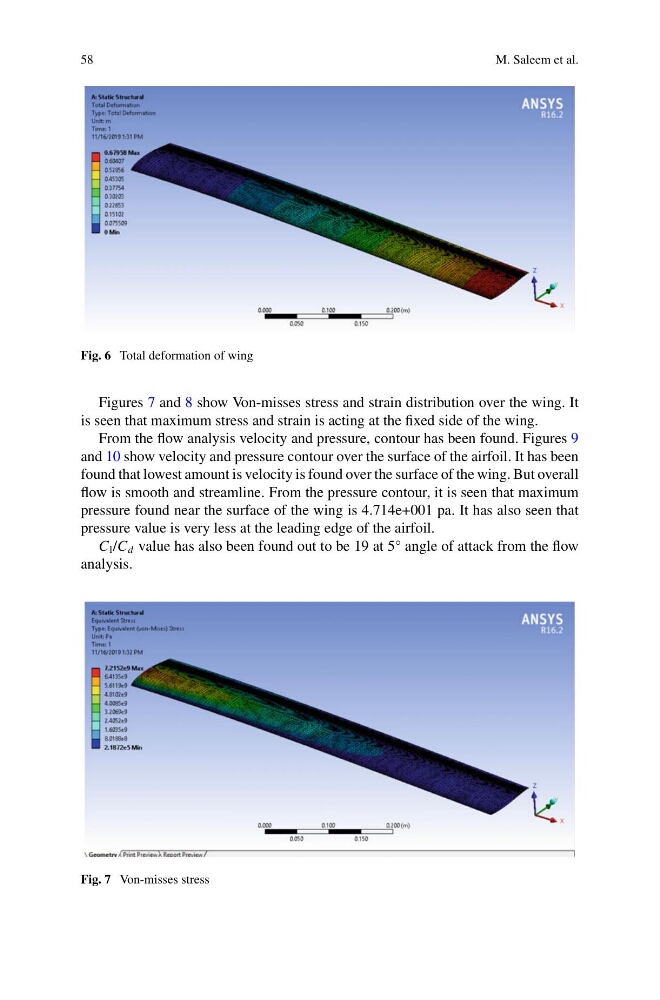
Fig. 6 Total deformation of wing
Figures 7 and 8 show Von-misses stress and strain distribution over the wing. It
is seen that maximum stress and strain is acting at the fixed side of the wing.
From the flow analysis velocity and pressure, contour has been found. Figures 9
and 10 show velocity and pressure contour over the surface of the airfoil. It has been
found that lowest amount is velocity is found over the surface of the wing. But overall
flow is smooth and streamline. From the pressure contour, it is seen that maximum
pressure found near the surface of the wing is 4.714e+001 pa. It has also seen that
pressure value is very less at the leading edge of the airfoil.
C l /C d value has also been found out to be 19 at 5° angle of attack from the flow
analysis.
Fig. 7 Von-misses stress
M. Saleem et al.
Fig. 6 Total deformation of wing
Figures 7 and 8 show Von-misses stress and strain distribution over the wing. It
is seen that maximum stress and strain is acting at the fixed side of the wing.
From the flow analysis velocity and pressure, contour has been found. Figures 9
and 10 show velocity and pressure contour over the surface of the airfoil. It has been
found that lowest amount is velocity is found over the surface of the wing. But overall
flow is smooth and streamline. From the pressure contour, it is seen that maximum
pressure found near the surface of the wing is 4.714e+001 pa. It has also seen that
pressure value is very less at the leading edge of the airfoil.
C l /C d value has also been found out to be 19 at 5° angle of attack from the flow
analysis.
Fig. 7 Von-misses stress