

Optimization and Analysis of Front Telescopic Suspension …
45
Table 1 Design parameters of bike
S. No.
Design parameter Value
S. No.
Design parameter
Value
1
Caster angle
30°
9
Kerb weight of
vehicle
50 kg
2
Wheel base
1.5 m
10
Rider weight
100 kg
3
Front tire radius
245 mm
11
Link material
Steel
4
Rear tire radius
245 mm
12
Unsprung mass of
vehicle on rear and
front link
10 and 5 kg
5
Handle level
950 mm
13
Tire and road models implemented
as available in ADAMS library
6
Bump height
100 mm
14
Vehicle and rider weight are
considered as point load on frame
7
Span of bump
77 cm
8
Vehicle speed
10, 15, 20 km/h
Table 2 Simulation results of ADAMS software
Location
Stiffness (K) (N/mm) Damping coefficient (C)
(N s/mm)
Preload (kg)
Traditional suspension
Front (each leg)
20
0.6
30
Rear
70
3
50
Optimized suspension
Front primary (each leg)
18
1
20
Front secondary (each leg) 2
0.1
3
Rear
70
3
50
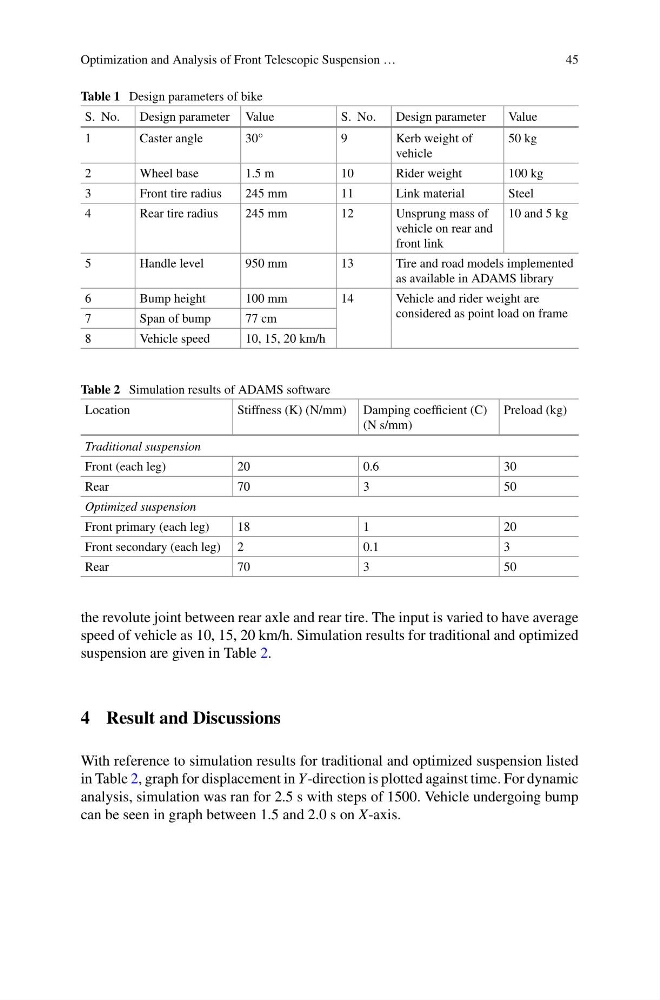
the revolute joint between rear axle and rear tire. The input is varied to have average
speed of vehicle as 10, 15, 20 km/h. Simulation results for traditional and optimized
suspension are given in Table 2.
4 Result and Discussions
With reference to simulation results for traditional and optimized suspension listed
in Table 2, graph for displacement in Y-direction is plotted against time. For dynamic
analysis, simulation was ran for 2.5 s with steps of 1500. Vehicle undergoing bump
can be seen in graph between 1.5 and 2.0 s on X-axis.
45
Table 1 Design parameters of bike
S. No.
Design parameter Value
S. No.
Design parameter
Value
1
Caster angle
30°
9
Kerb weight of
vehicle
50 kg
2
Wheel base
1.5 m
10
Rider weight
100 kg
3
Front tire radius
245 mm
11
Link material
Steel
4
Rear tire radius
245 mm
12
Unsprung mass of
vehicle on rear and
front link
10 and 5 kg
5
Handle level
950 mm
13
Tire and road models implemented
as available in ADAMS library
6
Bump height
100 mm
14
Vehicle and rider weight are
considered as point load on frame
7
Span of bump
77 cm
8
Vehicle speed
10, 15, 20 km/h
Table 2 Simulation results of ADAMS software
Location
Stiffness (K) (N/mm) Damping coefficient (C)
(N s/mm)
Preload (kg)
Traditional suspension
Front (each leg)
20
0.6
30
Rear
70
3
50
Optimized suspension
Front primary (each leg)
18
1
20
Front secondary (each leg) 2
0.1
3
Rear
70
3
50
the revolute joint between rear axle and rear tire. The input is varied to have average
speed of vehicle as 10, 15, 20 km/h. Simulation results for traditional and optimized
suspension are given in Table 2.
4 Result and Discussions
With reference to simulation results for traditional and optimized suspension listed
in Table 2, graph for displacement in Y-direction is plotted against time. For dynamic
analysis, simulation was ran for 2.5 s with steps of 1500. Vehicle undergoing bump
can be seen in graph between 1.5 and 2.0 s on X-axis.