

Laser Machining of AISI 304: An Experimental Study …
543
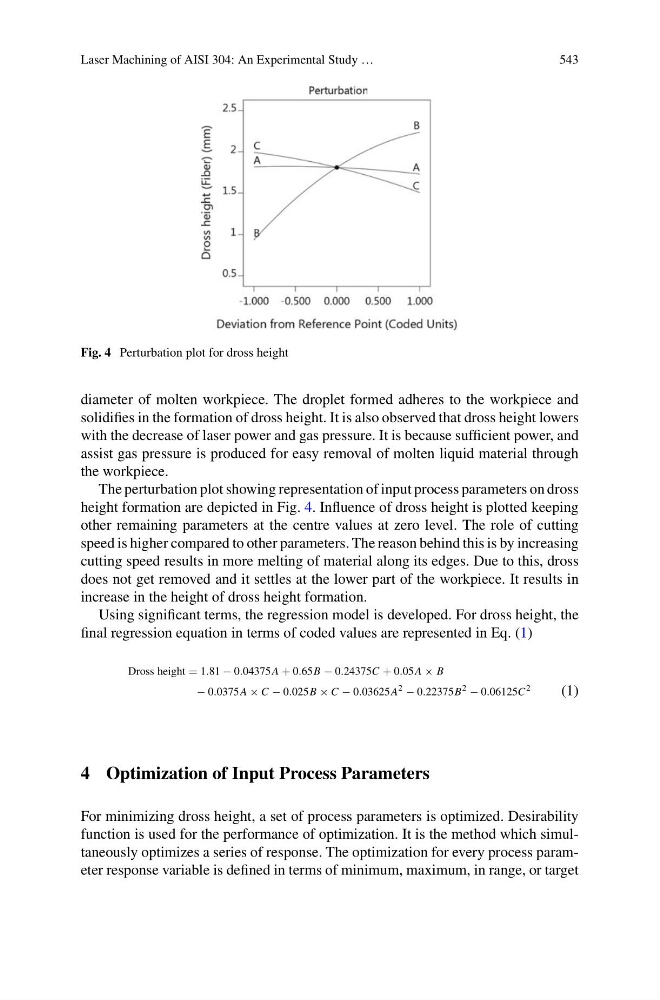
Fig. 4 Perturbation plot for dross height
diameter of molten workpiece. The droplet formed adheres to the workpiece and
solidifies in the formation of dross height. It is also observed that dross height lowers
with the decrease of laser power and gas pressure. It is because sufficient power, and
assist gas pressure is produced for easy removal of molten liquid material through
the workpiece.
The perturbation plot showing representation of input process parameters on dross
height formation are depicted in Fig. 4. Influence of dross height is plotted keeping
other remaining parameters at the centre values at zero level. The role of cutting
speed is higher compared to other parameters. The reason behind this is by increasing
cutting speed results in more melting of material along its edges. Due to this, dross
does not get removed and it settles at the lower part of the workpiece. It results in
increase in the height of dross height formation.
Using significant terms, the regression model is developed. For dross height, the
final regression equation in terms of coded values are represented in Eq. (1)
Dross height = 1.81 − 0.04375A + 0.65B − 0.24375C + 0.05A × B
− 0.0375A × C − 0.025B × C − 0.03625A
2 − 0.22375B
2 − 0.06125C
2
(1)
4 Optimization of Input Process Parameters
For minimizing dross height, a set of process parameters is optimized. Desirability
function is used for the performance of optimization. It is the method which simultaneously optimizes a series of response. The optimization for every process parameter response variable is defined in terms of minimum, maximum, in range, or target
543
Fig. 4 Perturbation plot for dross height
diameter of molten workpiece. The droplet formed adheres to the workpiece and
solidifies in the formation of dross height. It is also observed that dross height lowers
with the decrease of laser power and gas pressure. It is because sufficient power, and
assist gas pressure is produced for easy removal of molten liquid material through
the workpiece.
The perturbation plot showing representation of input process parameters on dross
height formation are depicted in Fig. 4. Influence of dross height is plotted keeping
other remaining parameters at the centre values at zero level. The role of cutting
speed is higher compared to other parameters. The reason behind this is by increasing
cutting speed results in more melting of material along its edges. Due to this, dross
does not get removed and it settles at the lower part of the workpiece. It results in
increase in the height of dross height formation.
Using significant terms, the regression model is developed. For dross height, the
final regression equation in terms of coded values are represented in Eq. (1)
Dross height = 1.81 − 0.04375A + 0.65B − 0.24375C + 0.05A × B
− 0.0375A × C − 0.025B × C − 0.03625A
2 − 0.22375B
2 − 0.06125C
2
(1)
4 Optimization of Input Process Parameters
For minimizing dross height, a set of process parameters is optimized. Desirability
function is used for the performance of optimization. It is the method which simultaneously optimizes a series of response. The optimization for every process parameter response variable is defined in terms of minimum, maximum, in range, or target