

Experimental Investigation on Geometric Accuracy …
219
The R
2 statistics for surface roughness study (i.e. R
2 and modified R
2 ) are given
in Table 6. The values of R
2
= 75.42% for surface roughness indicate that the model
describes 75.42% of overall variation in surface roughness. The modified R
2 is a
size-adjusted statistic; that is the number of factors. Values of modified R
2
= 65.17%
suggest that the model clarified 65.17% of overall variability. Surface roughness in
terms of R a obtained is in the range of 0.833–1.7803 µm. From ANOVA analysis,
the regression formula for surface roughness in terms of R a is given in Eq. 3,
R a = 0.410 + 0.00029 × F + 0.2604 × N + 0.387 × P
(3)
where
F Feed rate;
N Number of stages;
P Pitch Size.
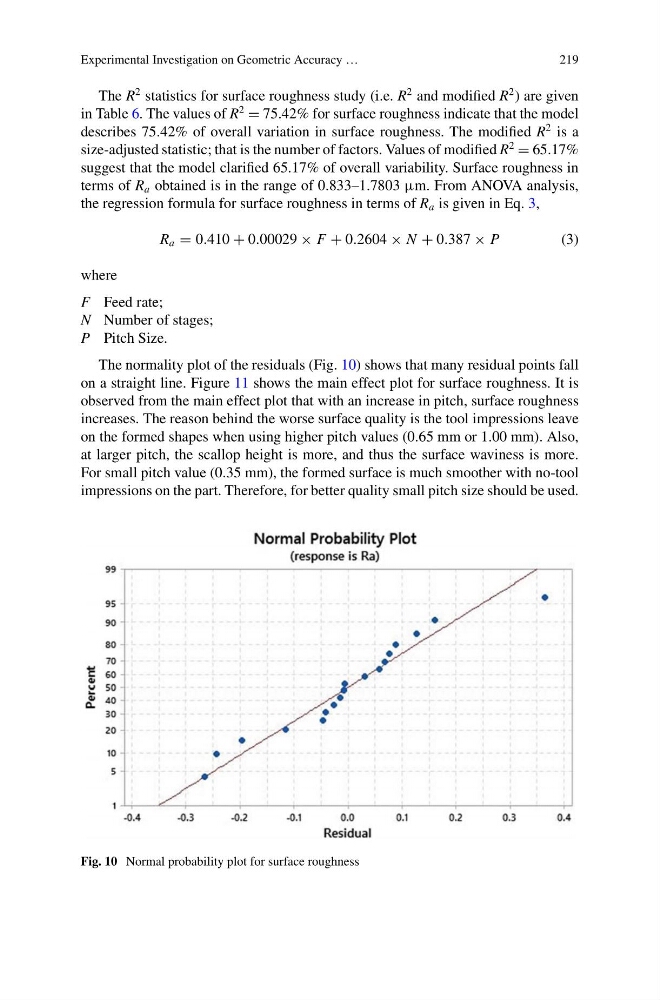
The normality plot of the residuals (Fig. 10) shows that many residual points fall
on a straight line. Figure 11 shows the main effect plot for surface roughness. It is
observed from the main effect plot that with an increase in pitch, surface roughness
increases. The reason behind the worse surface quality is the tool impressions leave
on the formed shapes when using higher pitch values (0.65 mm or 1.00 mm). Also,
at larger pitch, the scallop height is more, and thus the surface waviness is more.
For small pitch value (0.35 mm), the formed surface is much smoother with no-tool
impressions on the part. Therefore, for better quality small pitch size should be used.
Fig. 10 Normal probability plot for surface roughness
219
The R
2 statistics for surface roughness study (i.e. R
2 and modified R
2 ) are given
in Table 6. The values of R
2
= 75.42% for surface roughness indicate that the model
describes 75.42% of overall variation in surface roughness. The modified R
2 is a
size-adjusted statistic; that is the number of factors. Values of modified R
2
= 65.17%
suggest that the model clarified 65.17% of overall variability. Surface roughness in
terms of R a obtained is in the range of 0.833–1.7803 µm. From ANOVA analysis,
the regression formula for surface roughness in terms of R a is given in Eq. 3,
R a = 0.410 + 0.00029 × F + 0.2604 × N + 0.387 × P
(3)
where
F Feed rate;
N Number of stages;
P Pitch Size.
The normality plot of the residuals (Fig. 10) shows that many residual points fall
on a straight line. Figure 11 shows the main effect plot for surface roughness. It is
observed from the main effect plot that with an increase in pitch, surface roughness
increases. The reason behind the worse surface quality is the tool impressions leave
on the formed shapes when using higher pitch values (0.65 mm or 1.00 mm). Also,
at larger pitch, the scallop height is more, and thus the surface waviness is more.
For small pitch value (0.35 mm), the formed surface is much smoother with no-tool
impressions on the part. Therefore, for better quality small pitch size should be used.
Fig. 10 Normal probability plot for surface roughness