

196
S. M. Patil et al.
Table 4 Defects on bearing
elements
S. No.
Bearing element Type of defect Size
1
Rolling element Square
1 mm * 1 mm
2
Inner race
Square
1 mm * 1 mm
3
Outer race
Square
1 mm * 1 mm
4
Rolling element Circular
1 mm ø
5
Inner race
Circular
1 mm ø
6
Outer race
Circular
1 mm ø
(a) Rolling element
(b) Inner race
(c) Outer race
(I)
(d) Rolling element
(e) Inner race
(f) Outer race
(II)
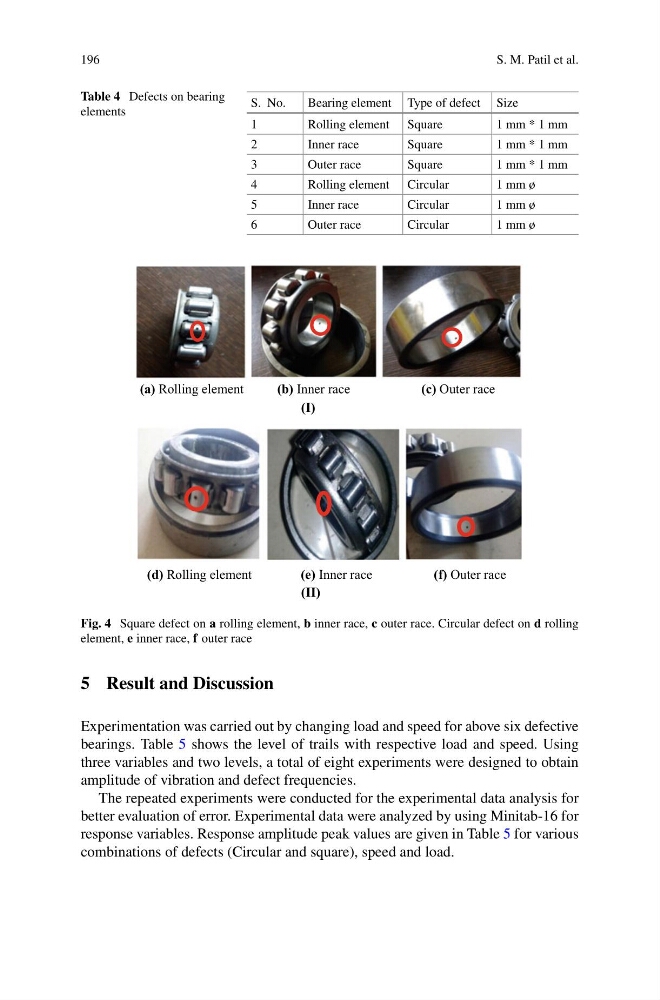
Fig. 4 Square defect on a rolling element, b inner race, c outer race. Circular defect on d rolling
element, e inner race, f outer race
5 Result and Discussion
Experimentation was carried out by changing load and speed for above six defective
bearings. Table 5 shows the level of trails with respective load and speed. Using
three variables and two levels, a total of eight experiments were designed to obtain
amplitude of vibration and defect frequencies.
The repeated experiments were conducted for the experimental data analysis for
better evaluation of error. Experimental data were analyzed by using Minitab-16 for
response variables. Response amplitude peak values are given in Table 5 for various
combinations of defects (Circular and square), speed and load.
S. M. Patil et al.
Table 4 Defects on bearing
elements
S. No.
Bearing element Type of defect Size
1
Rolling element Square
1 mm * 1 mm
2
Inner race
Square
1 mm * 1 mm
3
Outer race
Square
1 mm * 1 mm
4
Rolling element Circular
1 mm ø
5
Inner race
Circular
1 mm ø
6
Outer race
Circular
1 mm ø
(a) Rolling element
(b) Inner race
(c) Outer race
(I)
(d) Rolling element
(e) Inner race
(f) Outer race
(II)
Fig. 4 Square defect on a rolling element, b inner race, c outer race. Circular defect on d rolling
element, e inner race, f outer race
5 Result and Discussion
Experimentation was carried out by changing load and speed for above six defective
bearings. Table 5 shows the level of trails with respective load and speed. Using
three variables and two levels, a total of eight experiments were designed to obtain
amplitude of vibration and defect frequencies.
The repeated experiments were conducted for the experimental data analysis for
better evaluation of error. Experimental data were analyzed by using Minitab-16 for
response variables. Response amplitude peak values are given in Table 5 for various
combinations of defects (Circular and square), speed and load.