

individual trajectories. When compared to the high-trajectory group, the second,
third, fourth, and low-trajectory groups had HRs (95% CI) of 1.31 (0.99–1.74), 1.38
(0.99–1.92), 1.10 (0.55–2.20), and 2.01 (1.04–3.88), respectively, for all-cause
mortality, after adjustment for several covariates. For cause-specific death, the
low-trajectory group had a significantly higher HR for CVD mortality. The HRs
for other cause mortality (non-CVD death and noncancer death) were significantly
higher for the second and third trajectory groups than that for the high-trajectory
group.
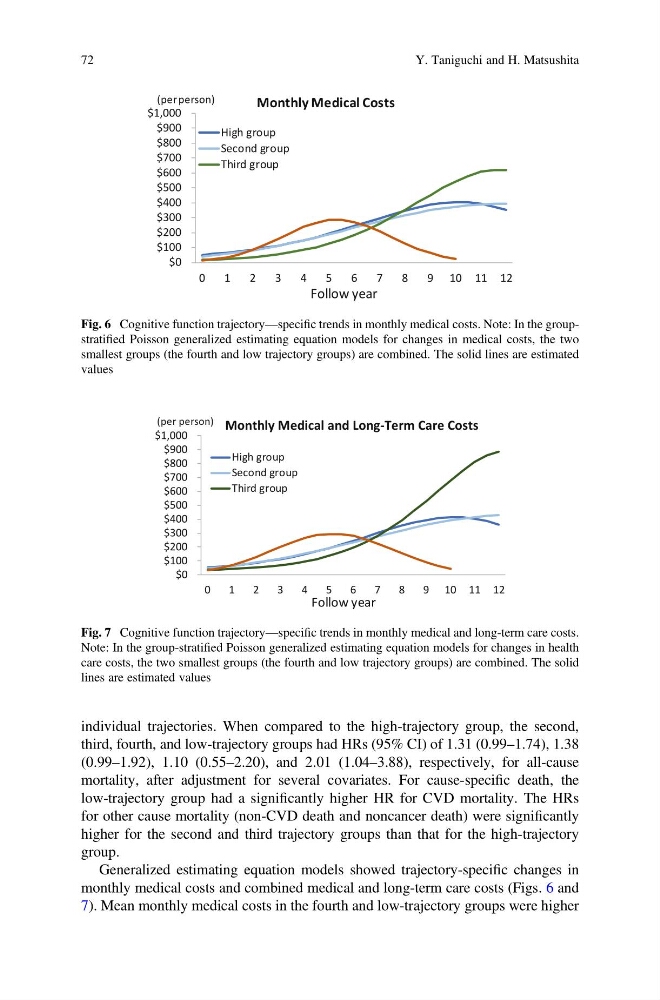
Generalized estimating equation models showed trajectory-specific changes in
monthly medical costs and combined medical and long-term care costs (Figs. 6 and
7). Mean monthly medical costs in the fourth and low-trajectory groups were higher
$0
$100
$200
$300
$400
$500
$600
$700
$800
$900
$1,000
0
1
2
3
4
5
6
7
8
9 10 11 12
High group
Second group
Third group
Follow year
(per person)
Monthly Medical Costs
Fig. 6 Cognitive function trajectory—specific trends in monthly medical costs. Note: In the groupstratified Poisson generalized estimating equation models for changes in medical costs, the two
smallest groups (the fourth and low trajectory groups) are combined. The solid lines are estimated
values
$0
$100
$200
$300
$400
$500
$600
$700
$800
$900
$1,000
0
1
2
3
4
5
6
7
8
9 10 11 12
High group
Second group
Third group
Follow year
(per person) Monthly Medical and Long-Term Care Costs
Fig. 7 Cognitive function trajectory—specific trends in monthly medical and long-term care costs.
Note: In the group-stratified Poisson generalized estimating equation models for changes in health
care costs, the two smallest groups (the fourth and low trajectory groups) are combined. The solid
lines are estimated values
72
Y. Taniguchi and H. Matsushita
third, fourth, and low-trajectory groups had HRs (95% CI) of 1.31 (0.99–1.74), 1.38
(0.99–1.92), 1.10 (0.55–2.20), and 2.01 (1.04–3.88), respectively, for all-cause
mortality, after adjustment for several covariates. For cause-specific death, the
low-trajectory group had a significantly higher HR for CVD mortality. The HRs
for other cause mortality (non-CVD death and noncancer death) were significantly
higher for the second and third trajectory groups than that for the high-trajectory
group.
Generalized estimating equation models showed trajectory-specific changes in
monthly medical costs and combined medical and long-term care costs (Figs. 6 and
7). Mean monthly medical costs in the fourth and low-trajectory groups were higher
$0
$100
$200
$300
$400
$500
$600
$700
$800
$900
$1,000
0
1
2
3
4
5
6
7
8
9 10 11 12
High group
Second group
Third group
Follow year
(per person)
Monthly Medical Costs
Fig. 6 Cognitive function trajectory—specific trends in monthly medical costs. Note: In the groupstratified Poisson generalized estimating equation models for changes in medical costs, the two
smallest groups (the fourth and low trajectory groups) are combined. The solid lines are estimated
values
$0
$100
$200
$300
$400
$500
$600
$700
$800
$900
$1,000
0
1
2
3
4
5
6
7
8
9 10 11 12
High group
Second group
Third group
Follow year
(per person) Monthly Medical and Long-Term Care Costs
Fig. 7 Cognitive function trajectory—specific trends in monthly medical and long-term care costs.
Note: In the group-stratified Poisson generalized estimating equation models for changes in health
care costs, the two smallest groups (the fourth and low trajectory groups) are combined. The solid
lines are estimated values
72
Y. Taniguchi and H. Matsushita