

persons need to use LTCI, they submit a request to the municipal government for
their primary physicians to assess and evaluate their physical and mental status.
Using these results, a local Long-Term Care Needs Certification Board determines
eligibility and the care level needed for insured residents. Care services using allotted
benefits are coordinated by a care manager, in collaboration with the insured person
and their family. Using insurance claims data from the National Health Insurance
system, health insurance for older people and data on LTCI beneficiaries, I calculated monthly medical costs and the combined monthly medical and long-term care
costs. Costs are expressed in US dollars (1 US dollar ¼ 111.02 Japanese yen). Data
from the baseline survey showed that the mean (SD) age of participants was 71.5
(5.9) years and that 56.6% were women. The average number of years of education
was 10.0 (2.7).
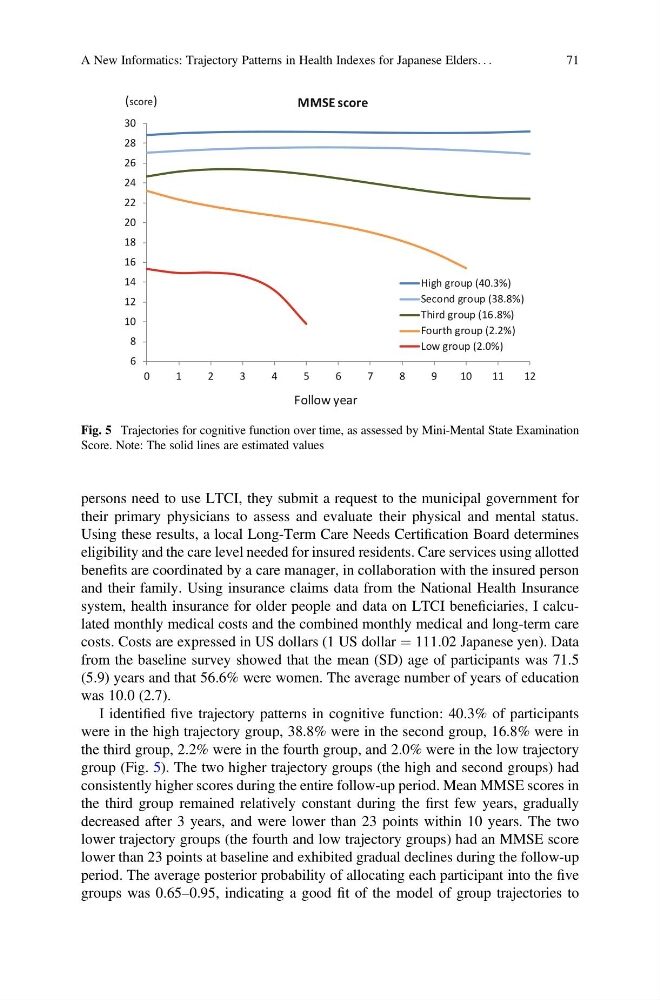
I identified five trajectory patterns in cognitive function: 40.3% of participants
were in the high trajectory group, 38.8% were in the second group, 16.8% were in
the third group, 2.2% were in the fourth group, and 2.0% were in the low trajectory
group (Fig. 5). The two higher trajectory groups (the high and second groups) had
consistently higher scores during the entire follow-up period. Mean MMSE scores in
the third group remained relatively constant during the first few years, gradually
decreased after 3 years, and were lower than 23 points within 10 years. The two
lower trajectory groups (the fourth and low trajectory groups) had an MMSE score
lower than 23 points at baseline and exhibited gradual declines during the follow-up
period. The average posterior probability of allocating each participant into the five
groups was 0.65–0.95, indicating a good fit of the model of group trajectories to
6
8
10
12
14
16
18
20
22
24
26
28
30
0
1
2
3
4
5
6
7
8
9
10
11
12
High group (40.3%)
Second group (38.8%)
Third group (16.8%)
Fourth group (2.2%)
Low group (2.0%)
(score)
Follow year
MMSE score
Fig. 5 Trajectories for cognitive function over time, as assessed by Mini-Mental State Examination
Score. Note: The solid lines are estimated values
A New Informatics: Trajectory Patterns in Health Indexes for Japanese Elders. . .
71
their primary physicians to assess and evaluate their physical and mental status.
Using these results, a local Long-Term Care Needs Certification Board determines
eligibility and the care level needed for insured residents. Care services using allotted
benefits are coordinated by a care manager, in collaboration with the insured person
and their family. Using insurance claims data from the National Health Insurance
system, health insurance for older people and data on LTCI beneficiaries, I calculated monthly medical costs and the combined monthly medical and long-term care
costs. Costs are expressed in US dollars (1 US dollar ¼ 111.02 Japanese yen). Data
from the baseline survey showed that the mean (SD) age of participants was 71.5
(5.9) years and that 56.6% were women. The average number of years of education
was 10.0 (2.7).
I identified five trajectory patterns in cognitive function: 40.3% of participants
were in the high trajectory group, 38.8% were in the second group, 16.8% were in
the third group, 2.2% were in the fourth group, and 2.0% were in the low trajectory
group (Fig. 5). The two higher trajectory groups (the high and second groups) had
consistently higher scores during the entire follow-up period. Mean MMSE scores in
the third group remained relatively constant during the first few years, gradually
decreased after 3 years, and were lower than 23 points within 10 years. The two
lower trajectory groups (the fourth and low trajectory groups) had an MMSE score
lower than 23 points at baseline and exhibited gradual declines during the follow-up
period. The average posterior probability of allocating each participant into the five
groups was 0.65–0.95, indicating a good fit of the model of group trajectories to
6
8
10
12
14
16
18
20
22
24
26
28
30
0
1
2
3
4
5
6
7
8
9
10
11
12
High group (40.3%)
Second group (38.8%)
Third group (16.8%)
Fourth group (2.2%)
Low group (2.0%)
(score)
Follow year
MMSE score
Fig. 5 Trajectories for cognitive function over time, as assessed by Mini-Mental State Examination
Score. Note: The solid lines are estimated values
A New Informatics: Trajectory Patterns in Health Indexes for Japanese Elders. . .
71