

0
50 100 150 200 250
0
10
20
30
40
50
60
70
80
90
100
0
50 100 150 200 250
0
10
20
30
40
50
60
70
80
90
100
0
50 100 150 200 250
0
10
20
30
40
50
60
70
80
90
100
0
50 100 150 200 250
0
10
20
30
40
50
60
70
80
90
100
1990 (Actual figures)
2025
2060
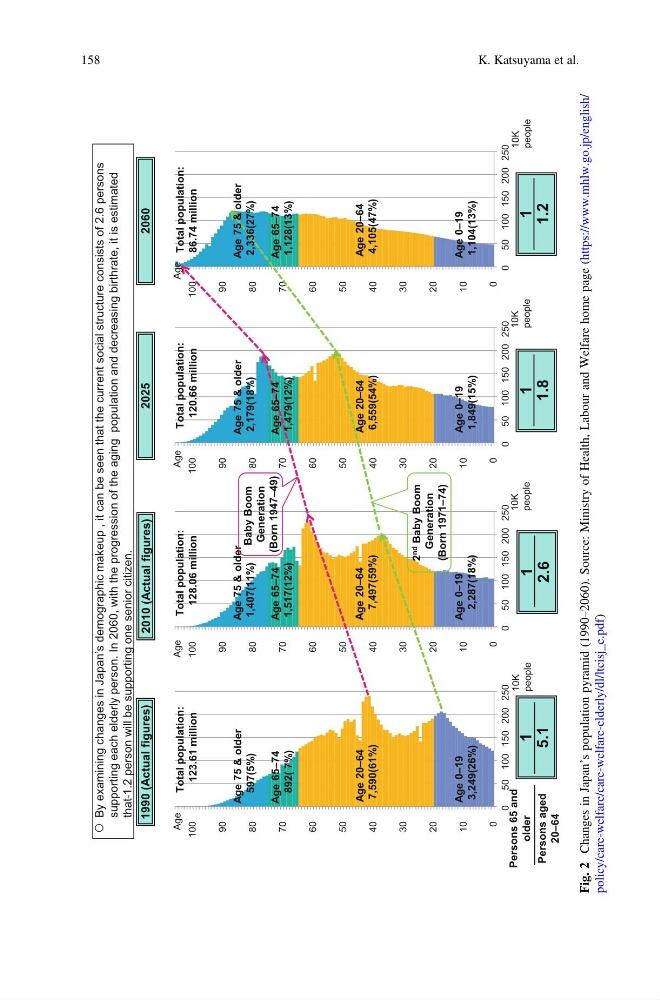
By examining changes in Japan’s demographic makeup , it can be seen that the current social structure consists of 2.6 persons
supporting each elderly person. In 2060, with the progression of the aging population and decreasing birthrate, it is estimated
that 1.2 person will be supporting one senior citizen.
2010 (Actual figures)
Persons 65 and
older
Persons aged
20–64
1
5.1
1
1.8
1
1.2
1
2.6
2 nd
Baby Boom
Generation
(Born 1971–74)
Age 75 & older
597(5%)
Age 65–74
892( 7%)
Age 20–64
7,590(61%)
Age 0–19
3,249(26%)
Total population:
123.61 million
Age 75 & older
1,407(11%)
Age 65–74
1,517(12%)
Age 20–64
7,497(59%)
Age 0–19
2,287(18%)
Total population:
128.06 million
Age 75 & older
2,179(18%)
Age 65–74
1,479(12%)
Age 20–64
6,559(54%)
Age 0–19
1,849(15%)
Total population:
120.66 million
Age 75 & older
2,336(27%)
Age 65–74
1,128(13%)
Age 20–64
4,105(47%)
Age 0–19
1,104(13%)
Total population:
86.74 million
e
g
A
e
g
A
e
g
A
e
g
A
10K
people
10K
people
10K
people
10K
people
Baby Boom
Generation
(Born 1947–49)
Fig. 2
Changes in Japan’s population pyramid (1990–2060). Source: Ministry of Health, Labour and Welfare home page (https://www.mhlw.go.jp/english/
policy/care-welfare/care-welfare-elderly/dl/ltcisj_e.pdf)
158
K. Katsuyama et al.
50 100 150 200 250
0
10
20
30
40
50
60
70
80
90
100
0
50 100 150 200 250
0
10
20
30
40
50
60
70
80
90
100
0
50 100 150 200 250
0
10
20
30
40
50
60
70
80
90
100
0
50 100 150 200 250
0
10
20
30
40
50
60
70
80
90
100
1990 (Actual figures)
2025
2060
By examining changes in Japan’s demographic makeup , it can be seen that the current social structure consists of 2.6 persons
supporting each elderly person. In 2060, with the progression of the aging population and decreasing birthrate, it is estimated
that 1.2 person will be supporting one senior citizen.
2010 (Actual figures)
Persons 65 and
older
Persons aged
20–64
1
5.1
1
1.8
1
1.2
1
2.6
2 nd
Baby Boom
Generation
(Born 1971–74)
Age 75 & older
597(5%)
Age 65–74
892( 7%)
Age 20–64
7,590(61%)
Age 0–19
3,249(26%)
Total population:
123.61 million
Age 75 & older
1,407(11%)
Age 65–74
1,517(12%)
Age 20–64
7,497(59%)
Age 0–19
2,287(18%)
Total population:
128.06 million
Age 75 & older
2,179(18%)
Age 65–74
1,479(12%)
Age 20–64
6,559(54%)
Age 0–19
1,849(15%)
Total population:
120.66 million
Age 75 & older
2,336(27%)
Age 65–74
1,128(13%)
Age 20–64
4,105(47%)
Age 0–19
1,104(13%)
Total population:
86.74 million
e
g
A
e
g
A
e
g
A
e
g
A
10K
people
10K
people
10K
people
10K
people
Baby Boom
Generation
(Born 1947–49)
Fig. 2
Changes in Japan’s population pyramid (1990–2060). Source: Ministry of Health, Labour and Welfare home page (https://www.mhlw.go.jp/english/
policy/care-welfare/care-welfare-elderly/dl/ltcisj_e.pdf)
158
K. Katsuyama et al.