

2.2 Conventional Approaches for Non-hazardous Solid Waste Disposal
39
2.2.2.2 Thermal Treatment Processes: Environmental Emissions
and Control
Thermal treatment has the advantage of the reduction of the volume/amount of waste
for disposal. However, it creates gaseous emissions and ash that contribute to negative
health and environmental impacts. Various pollutants are emitted from incinerators,
including CO, HCl, SO x , NO x , particulate matter (dust), polychlorinated dioxins
and furans (PCDD/Fs) with heavy metals being of major environmental concern
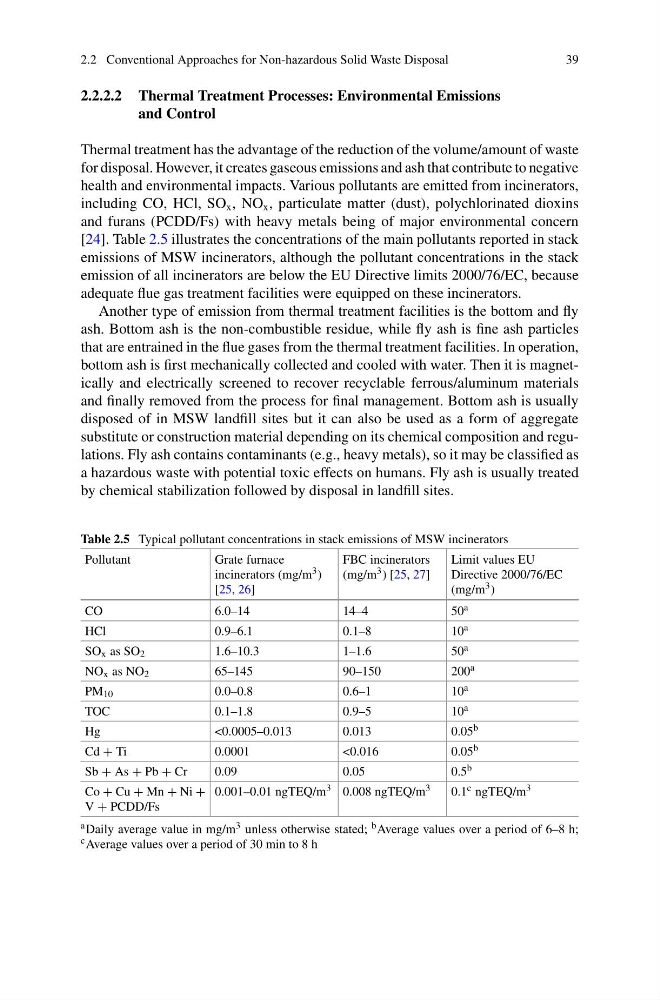
[24]. Table 2.5 illustrates the concentrations of the main pollutants reported in stack
emissions of MSW incinerators, although the pollutant concentrations in the stack
emission of all incinerators are below the EU Directive limits 2000/76/EC, because
adequate flue gas treatment facilities were equipped on these incinerators.
Another type of emission from thermal treatment facilities is the bottom and fly
ash. Bottom ash is the non-combustible residue, while fly ash is fine ash particles
that are entrained in the flue gases from the thermal treatment facilities. In operation,
bottom ash is first mechanically collected and cooled with water. Then it is magnetically and electrically screened to recover recyclable ferrous/aluminum materials
and finally removed from the process for final management. Bottom ash is usually
disposed of in MSW landfill sites but it can also be used as a form of aggregate
substitute or construction material depending on its chemical composition and regulations. Fly ash contains contaminants (e.g., heavy metals), so it may be classified as
a hazardous waste with potential toxic effects on humans. Fly ash is usually treated
by chemical stabilization followed by disposal in landfill sites.
Table 2.5 Typical pollutant concentrations in stack emissions of MSW incinerators
Pollutant
Grate furnace
incinerators (mg/m 3 )
[25, 26]
FBC incinerators
(mg/m 3 ) [25, 27]
Limit values EU
Directive 2000/76/EC
(mg/m 3 )
CO
6.0–14
14–4
50 a
HCl
0.9–6.1
0.1–8
10 a
SO x as SO 2
1.6–10.3
1–1.6
50 a
NO x as NO 2
65–145
90–150
200 a
PM 10
0.0–0.8
0.6–1
10 a
TOC
0.1–1.8
0.9–5
10 a
Hg
<0.0005–0.013
0.013
0.05 b
Cd + Ti
0.0001
<0.016
0.05 b
Sb + As + Pb + Cr
0.09
0.05
0.5 b
Co + Cu + Mn + Ni +
V + PCDD/Fs
0.001–0.01 ngTEQ/m 3 0.008 ngTEQ/m 3
0.1 c ngTEQ/m 3
a Daily average value in mg/m 3 unless otherwise stated; b Average values over a period of 6–8 h;
c Average values over a period of 30 min to 8 h
39
2.2.2.2 Thermal Treatment Processes: Environmental Emissions
and Control
Thermal treatment has the advantage of the reduction of the volume/amount of waste
for disposal. However, it creates gaseous emissions and ash that contribute to negative
health and environmental impacts. Various pollutants are emitted from incinerators,
including CO, HCl, SO x , NO x , particulate matter (dust), polychlorinated dioxins
and furans (PCDD/Fs) with heavy metals being of major environmental concern
[24]. Table 2.5 illustrates the concentrations of the main pollutants reported in stack
emissions of MSW incinerators, although the pollutant concentrations in the stack
emission of all incinerators are below the EU Directive limits 2000/76/EC, because
adequate flue gas treatment facilities were equipped on these incinerators.
Another type of emission from thermal treatment facilities is the bottom and fly
ash. Bottom ash is the non-combustible residue, while fly ash is fine ash particles
that are entrained in the flue gases from the thermal treatment facilities. In operation,
bottom ash is first mechanically collected and cooled with water. Then it is magnetically and electrically screened to recover recyclable ferrous/aluminum materials
and finally removed from the process for final management. Bottom ash is usually
disposed of in MSW landfill sites but it can also be used as a form of aggregate
substitute or construction material depending on its chemical composition and regulations. Fly ash contains contaminants (e.g., heavy metals), so it may be classified as
a hazardous waste with potential toxic effects on humans. Fly ash is usually treated
by chemical stabilization followed by disposal in landfill sites.
Table 2.5 Typical pollutant concentrations in stack emissions of MSW incinerators
Pollutant
Grate furnace
incinerators (mg/m 3 )
[25, 26]
FBC incinerators
(mg/m 3 ) [25, 27]
Limit values EU
Directive 2000/76/EC
(mg/m 3 )
CO
6.0–14
14–4
50 a
HCl
0.9–6.1
0.1–8
10 a
SO x as SO 2
1.6–10.3
1–1.6
50 a
NO x as NO 2
65–145
90–150
200 a
PM 10
0.0–0.8
0.6–1
10 a
TOC
0.1–1.8
0.9–5
10 a
Hg
<0.0005–0.013
0.013
0.05 b
Cd + Ti
0.0001
<0.016
0.05 b
Sb + As + Pb + Cr
0.09
0.05
0.5 b
Co + Cu + Mn + Ni +
V + PCDD/Fs
0.001–0.01 ngTEQ/m 3 0.008 ngTEQ/m 3
0.1 c ngTEQ/m 3
a Daily average value in mg/m 3 unless otherwise stated; b Average values over a period of 6–8 h;
c Average values over a period of 30 min to 8 h