

234
5 Phase Equilibrium
surface areas act as heterogeneous catalysts that allow adsorbed reactants to react on
their surfaces.
P R O B L E M S
Section 5.6: Surfaces in Multicomponent Systems
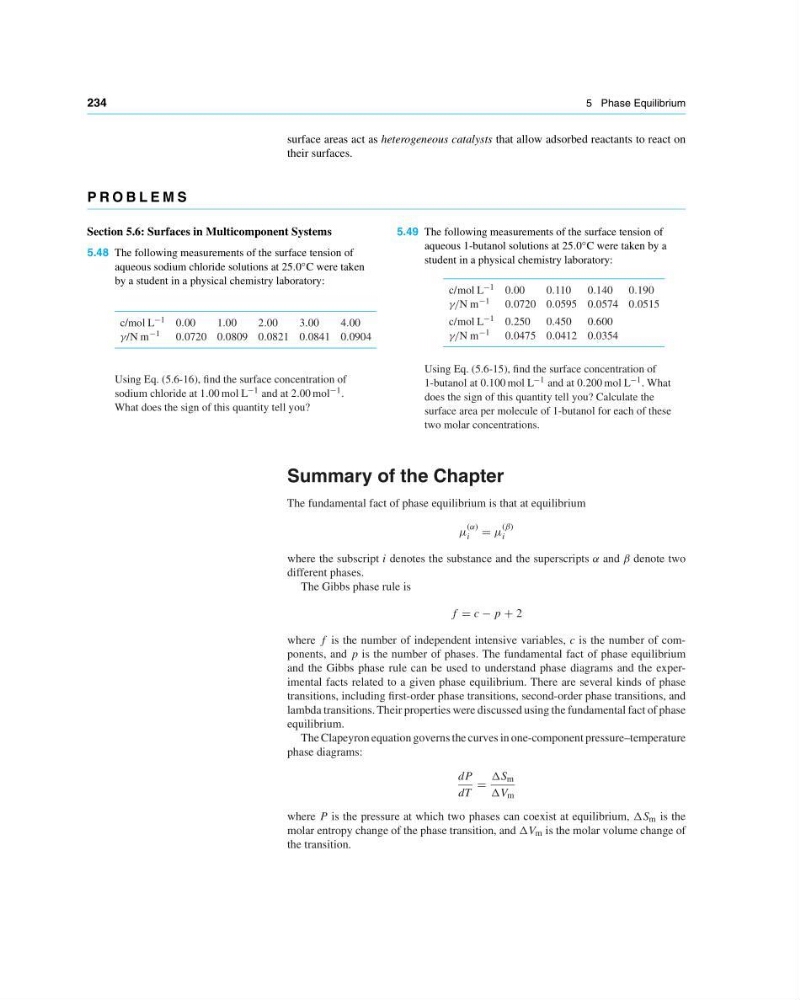
5.48 The following measurements of the surface tension of
aqueous sodium chloride solutions at 25.0 ◦ C were taken
by a student in a physical chemistry laboratory:
c/mol L −1 0.00
1.00
2.00
3.00
4.00
γ/N m −1 0.0720 0.0809 0.0821 0.0841 0.0904
Using Eq. (5.6-16), find the surface concentration of
sodium chloride at 1.00 mol L −1 and at 2.00 mol −1 .
What does the sign of this quantity tell you?
5.49 The following measurements of the surface tension of
aqueous 1-butanol solutions at 25.0 ◦ C were taken by a
student in a physical chemistry laboratory:
c/mol L −1 0.00
0.110 0.140 0.190
γ/N m −1 0.0720 0.0595 0.0574 0.0515
c/mol L −1 0.250 0.450 0.600
γ/N m −1 0.0475 0.0412 0.0354
Using Eq. (5.6-15), find the surface concentration of
1-butanol at 0.100 mol L −1 and at 0.200 mol L −1 . What
does the sign of this quantity tell you? Calculate the
surface area per molecule of 1-butanol for each of these
two molar concentrations.
Summary of the Chapter
The fundamental fact of phase equilibrium is that at equilibrium
µ
(α)
i µ
(β)
i
where the subscript i denotes the substance and the superscripts α and β denote two
different phases.
The Gibbs phase rule is
f c − p + 2
where f is the number of independent intensive variables, c is the number of components, and p is the number of phases. The fundamental fact of phase equilibrium
and the Gibbs phase rule can be used to understand phase diagrams and the experimental facts related to a given phase equilibrium. There are several kinds of phase
transitions, including first-order phase transitions, second-order phase transitions, and
lambda transitions. Their properties were discussed using the fundamental fact of phase
equilibrium.
The Clapeyron equation governs the curves in one-component pressure–temperature
phase diagrams:
dP
dT
∆S m
∆V m
where P is the pressure at which two phases can coexist at equilibrium, ∆S m is the
molar entropy change of the phase transition, and ∆V m is the molar volume change of
the transition.
5 Phase Equilibrium
surface areas act as heterogeneous catalysts that allow adsorbed reactants to react on
their surfaces.
P R O B L E M S
Section 5.6: Surfaces in Multicomponent Systems
5.48 The following measurements of the surface tension of
aqueous sodium chloride solutions at 25.0 ◦ C were taken
by a student in a physical chemistry laboratory:
c/mol L −1 0.00
1.00
2.00
3.00
4.00
γ/N m −1 0.0720 0.0809 0.0821 0.0841 0.0904
Using Eq. (5.6-16), find the surface concentration of
sodium chloride at 1.00 mol L −1 and at 2.00 mol −1 .
What does the sign of this quantity tell you?
5.49 The following measurements of the surface tension of
aqueous 1-butanol solutions at 25.0 ◦ C were taken by a
student in a physical chemistry laboratory:
c/mol L −1 0.00
0.110 0.140 0.190
γ/N m −1 0.0720 0.0595 0.0574 0.0515
c/mol L −1 0.250 0.450 0.600
γ/N m −1 0.0475 0.0412 0.0354
Using Eq. (5.6-15), find the surface concentration of
1-butanol at 0.100 mol L −1 and at 0.200 mol L −1 . What
does the sign of this quantity tell you? Calculate the
surface area per molecule of 1-butanol for each of these
two molar concentrations.
Summary of the Chapter
The fundamental fact of phase equilibrium is that at equilibrium
µ
(α)
i µ
(β)
i
where the subscript i denotes the substance and the superscripts α and β denote two
different phases.
The Gibbs phase rule is
f c − p + 2
where f is the number of independent intensive variables, c is the number of components, and p is the number of phases. The fundamental fact of phase equilibrium
and the Gibbs phase rule can be used to understand phase diagrams and the experimental facts related to a given phase equilibrium. There are several kinds of phase
transitions, including first-order phase transitions, second-order phase transitions, and
lambda transitions. Their properties were discussed using the fundamental fact of phase
equilibrium.
The Clapeyron equation governs the curves in one-component pressure–temperature
phase diagrams:
dP
dT
∆S m
∆V m
where P is the pressure at which two phases can coexist at equilibrium, ∆S m is the
molar entropy change of the phase transition, and ∆V m is the molar volume change of
the transition.