

68
F. Sagan and M. P. Mitoraj
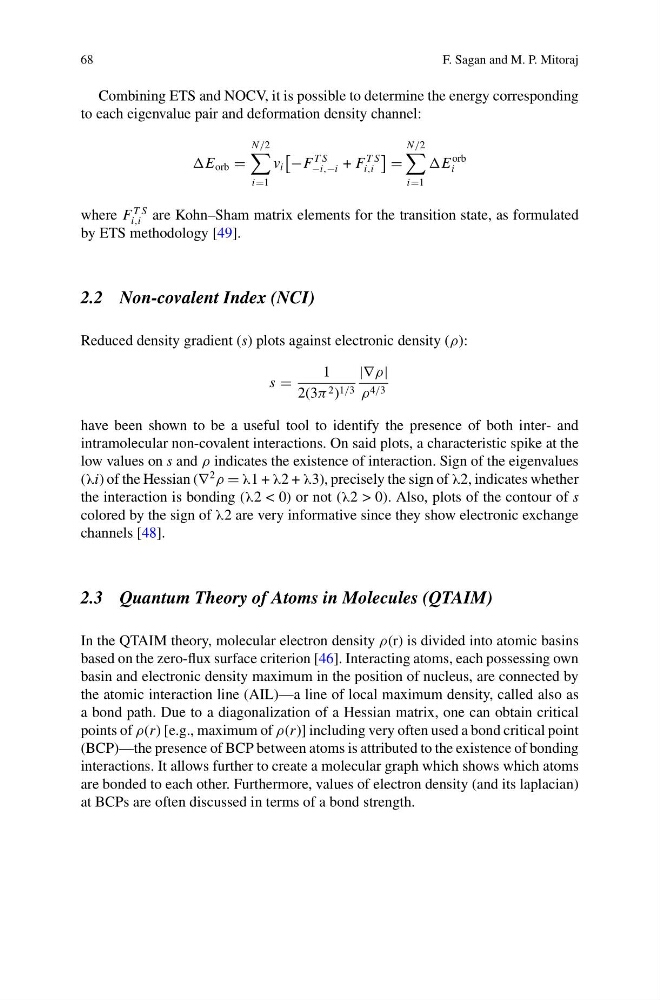
Combining ETS and NOCV, it is possible to determine the energy corresponding
to each eigenvalue pair and deformation density channel:
E orb
N /2
i1
v i
−F
T S
−i,−i + F
T S
i,i
N /2
i1
E
orb
i
where F
T S
i,i are Kohn–Sham matrix elements for the transition state, as formulated
by ETS methodology [49].
2.2 Non-covalent Index (NCI)
Reduced density gradient (s) plots against electronic density (ρ):
s
1
2(3π 2 ) 1/3
|∇ρ|
ρ 4/3
have been shown to be a useful tool to identify the presence of both inter- and
intramolecular non-covalent interactions. On said plots, a characteristic spike at the
low values on s and ρ indicates the existence of interaction. Sign of the eigenvalues
(λi) of the Hessian (∇
2
ρ λ1 + λ2 + λ3), precisely the sign of λ2, indicates whether
the interaction is bonding (λ2 < 0) or not (λ2 > 0). Also, plots of the contour of s
colored by the sign of λ2 are very informative since they show electronic exchange
channels [48].
2.3 Quantum Theory of Atoms in Molecules (QTAIM)
In the QTAIM theory, molecular electron density ρ(r) is divided into atomic basins
based on the zero-flux surface criterion [46]. Interacting atoms, each possessing own
basin and electronic density maximum in the position of nucleus, are connected by
the atomic interaction line (AIL)—a line of local maximum density, called also as
a bond path. Due to a diagonalization of a Hessian matrix, one can obtain critical
points of ρ(r) [e.g., maximum of ρ(r)] including very often used a bond critical point
(BCP)—the presence of BCP between atoms is attributed to the existence of bonding
interactions. It allows further to create a molecular graph which shows which atoms
are bonded to each other. Furthermore, values of electron density (and its laplacian)
at BCPs are often discussed in terms of a bond strength.
F. Sagan and M. P. Mitoraj
Combining ETS and NOCV, it is possible to determine the energy corresponding
to each eigenvalue pair and deformation density channel:
E orb
N /2
i1
v i
−F
T S
−i,−i + F
T S
i,i
N /2
i1
E
orb
i
where F
T S
i,i are Kohn–Sham matrix elements for the transition state, as formulated
by ETS methodology [49].
2.2 Non-covalent Index (NCI)
Reduced density gradient (s) plots against electronic density (ρ):
s
1
2(3π 2 ) 1/3
|∇ρ|
ρ 4/3
have been shown to be a useful tool to identify the presence of both inter- and
intramolecular non-covalent interactions. On said plots, a characteristic spike at the
low values on s and ρ indicates the existence of interaction. Sign of the eigenvalues
(λi) of the Hessian (∇
2
ρ λ1 + λ2 + λ3), precisely the sign of λ2, indicates whether
the interaction is bonding (λ2 < 0) or not (λ2 > 0). Also, plots of the contour of s
colored by the sign of λ2 are very informative since they show electronic exchange
channels [48].
2.3 Quantum Theory of Atoms in Molecules (QTAIM)
In the QTAIM theory, molecular electron density ρ(r) is divided into atomic basins
based on the zero-flux surface criterion [46]. Interacting atoms, each possessing own
basin and electronic density maximum in the position of nucleus, are connected by
the atomic interaction line (AIL)—a line of local maximum density, called also as
a bond path. Due to a diagonalization of a Hessian matrix, one can obtain critical
points of ρ(r) [e.g., maximum of ρ(r)] including very often used a bond critical point
(BCP)—the presence of BCP between atoms is attributed to the existence of bonding
interactions. It allows further to create a molecular graph which shows which atoms
are bonded to each other. Furthermore, values of electron density (and its laplacian)
at BCPs are often discussed in terms of a bond strength.