

Challenges in Modelling Metalloenzymes
517
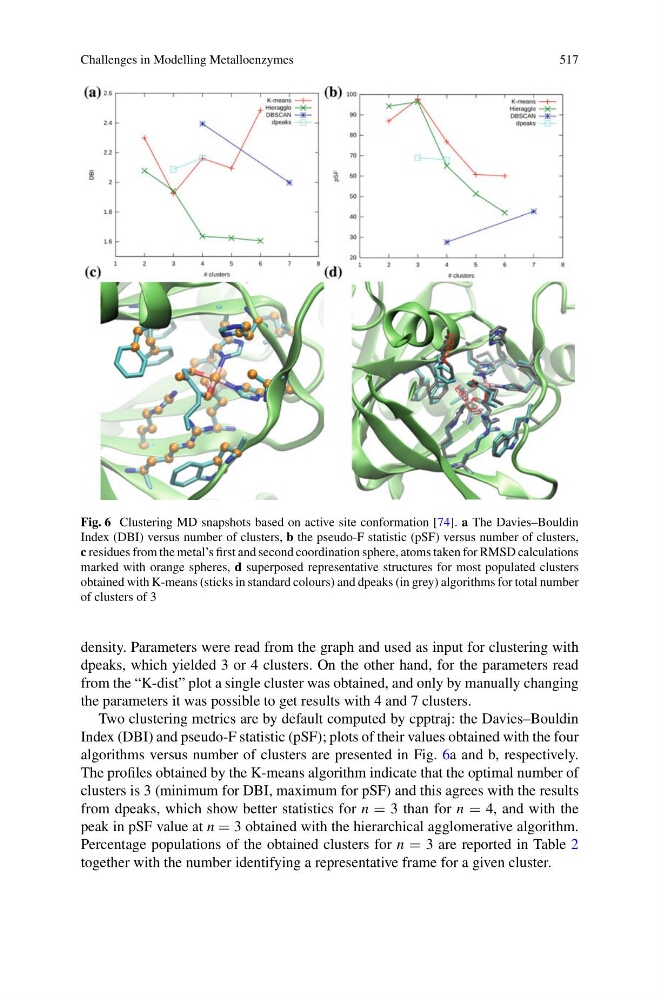
Fig. 6 Clustering MD snapshots based on active site conformation [74]. a The Davies–Bouldin
Index (DBI) versus number of clusters, b the pseudo-F statistic (pSF) versus number of clusters,
c residues from the metal’s first and second coordination sphere, atoms taken for RMSD calculations
marked with orange spheres, d superposed representative structures for most populated clusters
obtained with K-means (sticks in standard colours) and dpeaks (in grey) algorithms for total number
of clusters of 3
density. Parameters were read from the graph and used as input for clustering with
dpeaks, which yielded 3 or 4 clusters. On the other hand, for the parameters read
from the “K-dist” plot a single cluster was obtained, and only by manually changing
the parameters it was possible to get results with 4 and 7 clusters.
Two clustering metrics are by default computed by cpptraj: the Davies–Bouldin
Index (DBI) and pseudo-F statistic (pSF); plots of their values obtained with the four
algorithms versus number of clusters are presented in Fig. 6a and b, respectively.
The profiles obtained by the K-means algorithm indicate that the optimal number of
clusters is 3 (minimum for DBI, maximum for pSF) and this agrees with the results
from dpeaks, which show better statistics for n 3 than for n 4, and with the
peak in pSF value at n 3 obtained with the hierarchical agglomerative algorithm.
Percentage populations of the obtained clusters for n 3 are reported in Table 2
together with the number identifying a representative frame for a given cluster.
517
Fig. 6 Clustering MD snapshots based on active site conformation [74]. a The Davies–Bouldin
Index (DBI) versus number of clusters, b the pseudo-F statistic (pSF) versus number of clusters,
c residues from the metal’s first and second coordination sphere, atoms taken for RMSD calculations
marked with orange spheres, d superposed representative structures for most populated clusters
obtained with K-means (sticks in standard colours) and dpeaks (in grey) algorithms for total number
of clusters of 3
density. Parameters were read from the graph and used as input for clustering with
dpeaks, which yielded 3 or 4 clusters. On the other hand, for the parameters read
from the “K-dist” plot a single cluster was obtained, and only by manually changing
the parameters it was possible to get results with 4 and 7 clusters.
Two clustering metrics are by default computed by cpptraj: the Davies–Bouldin
Index (DBI) and pseudo-F statistic (pSF); plots of their values obtained with the four
algorithms versus number of clusters are presented in Fig. 6a and b, respectively.
The profiles obtained by the K-means algorithm indicate that the optimal number of
clusters is 3 (minimum for DBI, maximum for pSF) and this agrees with the results
from dpeaks, which show better statistics for n 3 than for n 4, and with the
peak in pSF value at n 3 obtained with the hierarchical agglomerative algorithm.
Percentage populations of the obtained clusters for n 3 are reported in Table 2
together with the number identifying a representative frame for a given cluster.