

Assessing Electronically Excited States of Cobalamins …
245
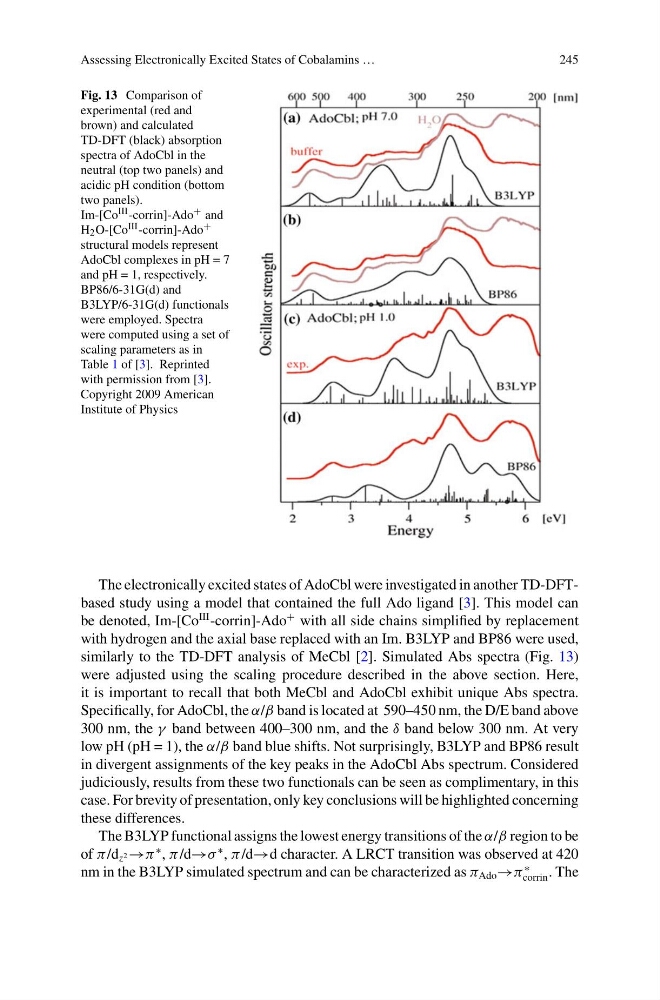
Fig. 13 Comparison of
experimental (red and
brown) and calculated
TD-DFT (black) absorption
spectra of AdoCbl in the
neutral (top two panels) and
acidic pH condition (bottom
two panels).
Im-[Co III -corrin]-Ado + and
H 2 O-[Co III -corrin]-Ado +
structural models represent
AdoCbl complexes in pH = 7
and pH = 1, respectively.
BP86/6-31G(d) and
B3LYP/6-31G(d) functionals
were employed. Spectra
were computed using a set of
scaling parameters as in
Table 1 of [3]. Reprinted
with permission from [3].
Copyright 2009 American
Institute of Physics
The electronically excited states of AdoCbl were investigated in another TD-DFTbased study using a model that contained the full Ado ligand [3]. This model can
be denoted, Im-[Co
III -corrin]-Ado
+ with all side chains simplified by replacement
with hydrogen and the axial base replaced with an Im. B3LYP and BP86 were used,
similarly to the TD-DFT analysis of MeCbl [2]. Simulated Abs spectra (Fig. 13)
were adjusted using the scaling procedure described in the above section. Here,
it is important to recall that both MeCbl and AdoCbl exhibit unique Abs spectra.
Specifically, for AdoCbl, the α/β band is located at 590–450 nm, the D/E band above
300 nm, the γ band between 400–300 nm, and the δ band below 300 nm. At very
low pH (pH = 1), the α/β band blue shifts. Not surprisingly, B3LYP and BP86 result
in divergent assignments of the key peaks in the AdoCbl Abs spectrum. Considered
judiciously, results from these two functionals can be seen as complimentary, in this
case. For brevity of presentation, only key conclusions will be highlighted concerning
these differences.
The B3LYP functional assigns the lowest energy transitions of the α/β region to be
of π /d z 2 →π
∗ , π /d→σ
∗ , π /d→d character. A LRCT transition was observed at 420
nm in the B3LYP simulated spectrum and can be characterized as π Ado →π
∗
corrin . The
245
Fig. 13 Comparison of
experimental (red and
brown) and calculated
TD-DFT (black) absorption
spectra of AdoCbl in the
neutral (top two panels) and
acidic pH condition (bottom
two panels).
Im-[Co III -corrin]-Ado + and
H 2 O-[Co III -corrin]-Ado +
structural models represent
AdoCbl complexes in pH = 7
and pH = 1, respectively.
BP86/6-31G(d) and
B3LYP/6-31G(d) functionals
were employed. Spectra
were computed using a set of
scaling parameters as in
Table 1 of [3]. Reprinted
with permission from [3].
Copyright 2009 American
Institute of Physics
The electronically excited states of AdoCbl were investigated in another TD-DFTbased study using a model that contained the full Ado ligand [3]. This model can
be denoted, Im-[Co
III -corrin]-Ado
+ with all side chains simplified by replacement
with hydrogen and the axial base replaced with an Im. B3LYP and BP86 were used,
similarly to the TD-DFT analysis of MeCbl [2]. Simulated Abs spectra (Fig. 13)
were adjusted using the scaling procedure described in the above section. Here,
it is important to recall that both MeCbl and AdoCbl exhibit unique Abs spectra.
Specifically, for AdoCbl, the α/β band is located at 590–450 nm, the D/E band above
300 nm, the γ band between 400–300 nm, and the δ band below 300 nm. At very
low pH (pH = 1), the α/β band blue shifts. Not surprisingly, B3LYP and BP86 result
in divergent assignments of the key peaks in the AdoCbl Abs spectrum. Considered
judiciously, results from these two functionals can be seen as complimentary, in this
case. For brevity of presentation, only key conclusions will be highlighted concerning
these differences.
The B3LYP functional assigns the lowest energy transitions of the α/β region to be
of π /d z 2 →π
∗ , π /d→σ
∗ , π /d→d character. A LRCT transition was observed at 420
nm in the B3LYP simulated spectrum and can be characterized as π Ado →π
∗
corrin . The