

230
M. J. Toda et al.
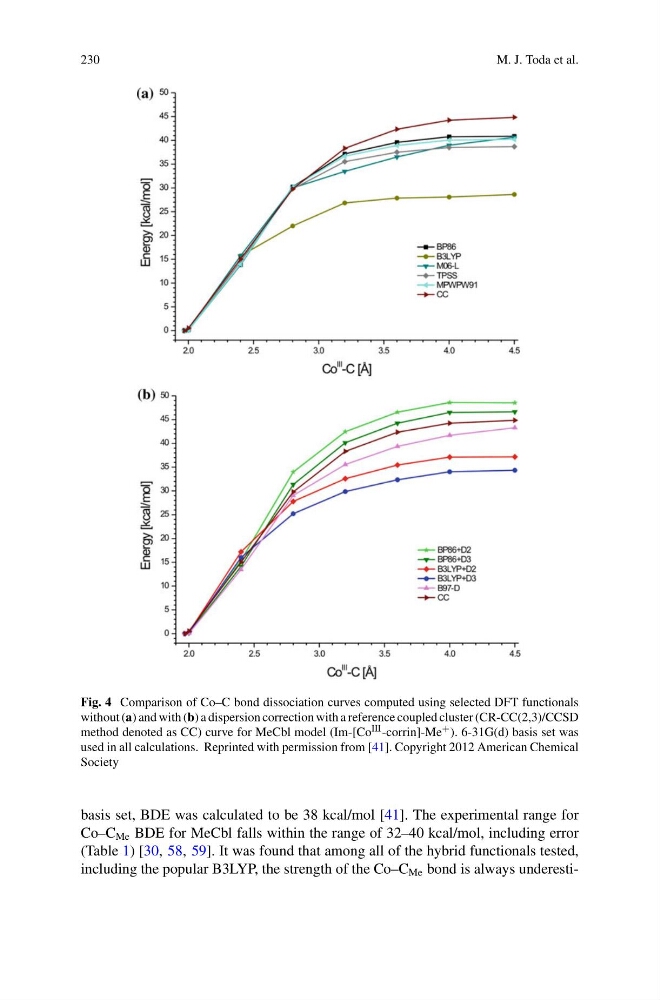
Fig. 4 Comparison of Co–C bond dissociation curves computed using selected DFT functionals
without (a) and with (b) a dispersion correction with a reference coupled cluster (CR-CC(2,3)/CCSD
method denoted as CC) curve for MeCbl model (Im-[Co III -corrin]-Me + ). 6-31G(d) basis set was
used in all calculations. Reprinted with permission from [41]. Copyright 2012 American Chemical
Society
basis set, BDE was calculated to be 38 kcal/mol [41]. The experimental range for
Co–C Me BDE for MeCbl falls within the range of 32–40 kcal/mol, including error
(Table 1) [30, 58, 59]. It was found that among all of the hybrid functionals tested,
including the popular B3LYP, the strength of the Co–C Me bond is always underesti-
M. J. Toda et al.
Fig. 4 Comparison of Co–C bond dissociation curves computed using selected DFT functionals
without (a) and with (b) a dispersion correction with a reference coupled cluster (CR-CC(2,3)/CCSD
method denoted as CC) curve for MeCbl model (Im-[Co III -corrin]-Me + ). 6-31G(d) basis set was
used in all calculations. Reprinted with permission from [41]. Copyright 2012 American Chemical
Society
basis set, BDE was calculated to be 38 kcal/mol [41]. The experimental range for
Co–C Me BDE for MeCbl falls within the range of 32–40 kcal/mol, including error
(Table 1) [30, 58, 59]. It was found that among all of the hybrid functionals tested,
including the popular B3LYP, the strength of the Co–C Me bond is always underesti-