

Multiconfigurational Approach to X-ray Spectroscopy …
203
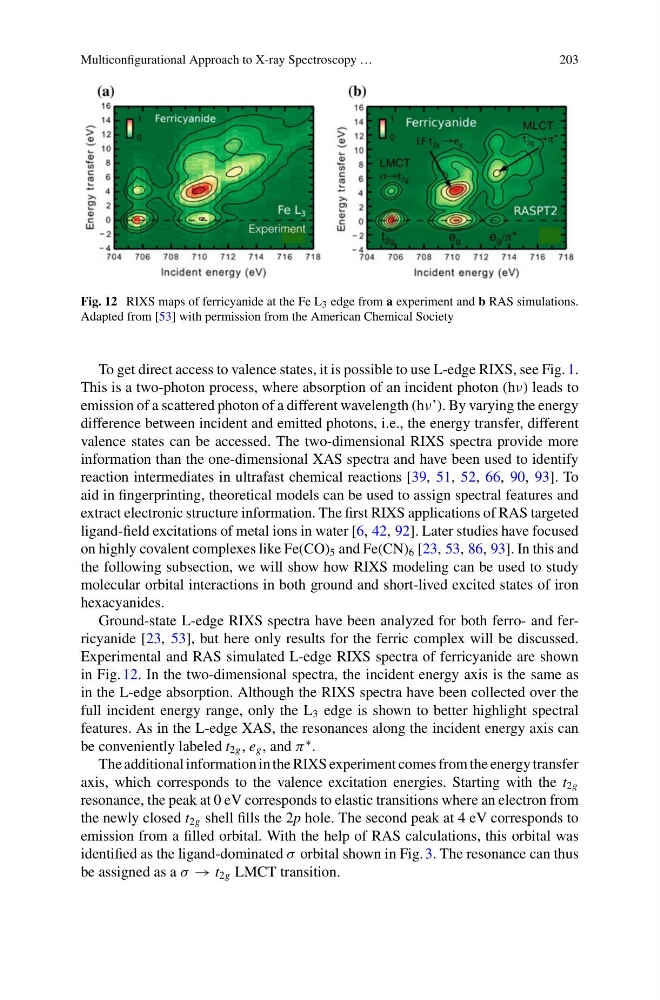
Fig. 12 RIXS maps of ferricyanide at the Fe L 3 edge from a experiment and b RAS simulations.
Adapted from [53] with permission from the American Chemical Society
To get direct access to valence states, it is possible to use L-edge RIXS, see Fig. 1.
This is a two-photon process, where absorption of an incident photon (hν) leads to
emission of a scattered photon of a different wavelength (hν’). By varying the energy
difference between incident and emitted photons, i.e., the energy transfer, different
valence states can be accessed. The two-dimensional RIXS spectra provide more
information than the one-dimensional XAS spectra and have been used to identify
reaction intermediates in ultrafast chemical reactions [39, 51, 52, 66, 90, 93]. To
aid in fingerprinting, theoretical models can be used to assign spectral features and
extract electronic structure information. The first RIXS applications of RAS targeted
ligand-field excitations of metal ions in water [6, 42, 92]. Later studies have focused
on highly covalent complexes like Fe(CO) 5 and Fe(CN) 6 [23, 53, 86, 93]. In this and
the following subsection, we will show how RIXS modeling can be used to study
molecular orbital interactions in both ground and short-lived excited states of iron
hexacyanides.
Ground-state L-edge RIXS spectra have been analyzed for both ferro- and ferricyanide [23, 53], but here only results for the ferric complex will be discussed.
Experimental and RAS simulated L-edge RIXS spectra of ferricyanide are shown
in Fig. 12. In the two-dimensional spectra, the incident energy axis is the same as
in the L-edge absorption. Although the RIXS spectra have been collected over the
full incident energy range, only the L 3 edge is shown to better highlight spectral
features. As in the L-edge XAS, the resonances along the incident energy axis can
be conveniently labeled t 2g , e g , and π
∗ .
The additional information in the RIXS experiment comes from the energy transfer
axis, which corresponds to the valence excitation energies. Starting with the t 2g
resonance, the peak at 0 eV corresponds to elastic transitions where an electron from
the newly closed t 2g shell fills the 2p hole. The second peak at 4 eV corresponds to
emission from a filled orbital. With the help of RAS calculations, this orbital was
identified as the ligand-dominated σ orbital shown in Fig. 3. The resonance can thus
be assigned as a σ → t 2g LMCT transition.
203
Fig. 12 RIXS maps of ferricyanide at the Fe L 3 edge from a experiment and b RAS simulations.
Adapted from [53] with permission from the American Chemical Society
To get direct access to valence states, it is possible to use L-edge RIXS, see Fig. 1.
This is a two-photon process, where absorption of an incident photon (hν) leads to
emission of a scattered photon of a different wavelength (hν’). By varying the energy
difference between incident and emitted photons, i.e., the energy transfer, different
valence states can be accessed. The two-dimensional RIXS spectra provide more
information than the one-dimensional XAS spectra and have been used to identify
reaction intermediates in ultrafast chemical reactions [39, 51, 52, 66, 90, 93]. To
aid in fingerprinting, theoretical models can be used to assign spectral features and
extract electronic structure information. The first RIXS applications of RAS targeted
ligand-field excitations of metal ions in water [6, 42, 92]. Later studies have focused
on highly covalent complexes like Fe(CO) 5 and Fe(CN) 6 [23, 53, 86, 93]. In this and
the following subsection, we will show how RIXS modeling can be used to study
molecular orbital interactions in both ground and short-lived excited states of iron
hexacyanides.
Ground-state L-edge RIXS spectra have been analyzed for both ferro- and ferricyanide [23, 53], but here only results for the ferric complex will be discussed.
Experimental and RAS simulated L-edge RIXS spectra of ferricyanide are shown
in Fig. 12. In the two-dimensional spectra, the incident energy axis is the same as
in the L-edge absorption. Although the RIXS spectra have been collected over the
full incident energy range, only the L 3 edge is shown to better highlight spectral
features. As in the L-edge XAS, the resonances along the incident energy axis can
be conveniently labeled t 2g , e g , and π
∗ .
The additional information in the RIXS experiment comes from the energy transfer
axis, which corresponds to the valence excitation energies. Starting with the t 2g
resonance, the peak at 0 eV corresponds to elastic transitions where an electron from
the newly closed t 2g shell fills the 2p hole. The second peak at 4 eV corresponds to
emission from a filled orbital. With the help of RAS calculations, this orbital was
identified as the ligand-dominated σ orbital shown in Fig. 3. The resonance can thus
be assigned as a σ → t 2g LMCT transition.