

Multiconfigurational Approach to X-ray Spectroscopy …
201
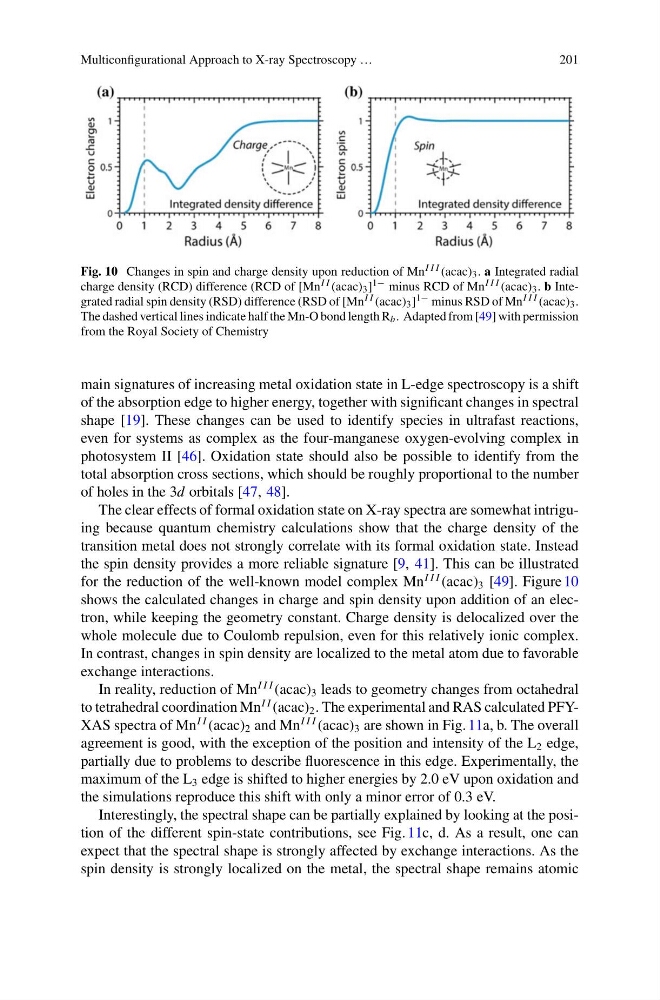
Fig. 10 Changes in spin and charge density upon reduction of Mn I I I (acac) 3 . a Integrated radial
charge density (RCD) difference (RCD of [Mn I I (acac) 3 ] 1− minus RCD of Mn I I I (acac) 3 . b Integrated radial spin density (RSD) difference (RSD of [Mn I I (acac) 3 ] 1− minus RSD of Mn I I I (acac) 3 .
The dashed vertical lines indicate half the Mn-O bond length R b . Adapted from [49] with permission
from the Royal Society of Chemistry
main signatures of increasing metal oxidation state in L-edge spectroscopy is a shift
of the absorption edge to higher energy, together with significant changes in spectral
shape [19]. These changes can be used to identify species in ultrafast reactions,
even for systems as complex as the four-manganese oxygen-evolving complex in
photosystem II [46]. Oxidation state should also be possible to identify from the
total absorption cross sections, which should be roughly proportional to the number
of holes in the 3d orbitals [47, 48].
The clear effects of formal oxidation state on X-ray spectra are somewhat intriguing because quantum chemistry calculations show that the charge density of the
transition metal does not strongly correlate with its formal oxidation state. Instead
the spin density provides a more reliable signature [9, 41]. This can be illustrated
for the reduction of the well-known model complex Mn
I I I (acac) 3 [49]. Figure 10
shows the calculated changes in charge and spin density upon addition of an electron, while keeping the geometry constant. Charge density is delocalized over the
whole molecule due to Coulomb repulsion, even for this relatively ionic complex.
In contrast, changes in spin density are localized to the metal atom due to favorable
exchange interactions.
In reality, reduction of Mn
I I I (acac) 3 leads to geometry changes from octahedral
to tetrahedral coordination Mn
I I (acac) 2 . The experimental and RAS calculated PFYXAS spectra of Mn
I I (acac) 2 and Mn
I I I (acac) 3 are shown in Fig. 11a, b. The overall
agreement is good, with the exception of the position and intensity of the L 2 edge,
partially due to problems to describe fluorescence in this edge. Experimentally, the
maximum of the L 3 edge is shifted to higher energies by 2.0 eV upon oxidation and
the simulations reproduce this shift with only a minor error of 0.3 eV.
Interestingly, the spectral shape can be partially explained by looking at the position of the different spin-state contributions, see Fig. 11c, d. As a result, one can
expect that the spectral shape is strongly affected by exchange interactions. As the
spin density is strongly localized on the metal, the spectral shape remains atomic
201
Fig. 10 Changes in spin and charge density upon reduction of Mn I I I (acac) 3 . a Integrated radial
charge density (RCD) difference (RCD of [Mn I I (acac) 3 ] 1− minus RCD of Mn I I I (acac) 3 . b Integrated radial spin density (RSD) difference (RSD of [Mn I I (acac) 3 ] 1− minus RSD of Mn I I I (acac) 3 .
The dashed vertical lines indicate half the Mn-O bond length R b . Adapted from [49] with permission
from the Royal Society of Chemistry
main signatures of increasing metal oxidation state in L-edge spectroscopy is a shift
of the absorption edge to higher energy, together with significant changes in spectral
shape [19]. These changes can be used to identify species in ultrafast reactions,
even for systems as complex as the four-manganese oxygen-evolving complex in
photosystem II [46]. Oxidation state should also be possible to identify from the
total absorption cross sections, which should be roughly proportional to the number
of holes in the 3d orbitals [47, 48].
The clear effects of formal oxidation state on X-ray spectra are somewhat intriguing because quantum chemistry calculations show that the charge density of the
transition metal does not strongly correlate with its formal oxidation state. Instead
the spin density provides a more reliable signature [9, 41]. This can be illustrated
for the reduction of the well-known model complex Mn
I I I (acac) 3 [49]. Figure 10
shows the calculated changes in charge and spin density upon addition of an electron, while keeping the geometry constant. Charge density is delocalized over the
whole molecule due to Coulomb repulsion, even for this relatively ionic complex.
In contrast, changes in spin density are localized to the metal atom due to favorable
exchange interactions.
In reality, reduction of Mn
I I I (acac) 3 leads to geometry changes from octahedral
to tetrahedral coordination Mn
I I (acac) 2 . The experimental and RAS calculated PFYXAS spectra of Mn
I I (acac) 2 and Mn
I I I (acac) 3 are shown in Fig. 11a, b. The overall
agreement is good, with the exception of the position and intensity of the L 2 edge,
partially due to problems to describe fluorescence in this edge. Experimentally, the
maximum of the L 3 edge is shifted to higher energies by 2.0 eV upon oxidation and
the simulations reproduce this shift with only a minor error of 0.3 eV.
Interestingly, the spectral shape can be partially explained by looking at the position of the different spin-state contributions, see Fig. 11c, d. As a result, one can
expect that the spectral shape is strongly affected by exchange interactions. As the
spin density is strongly localized on the metal, the spectral shape remains atomic