

64
5 Calibration
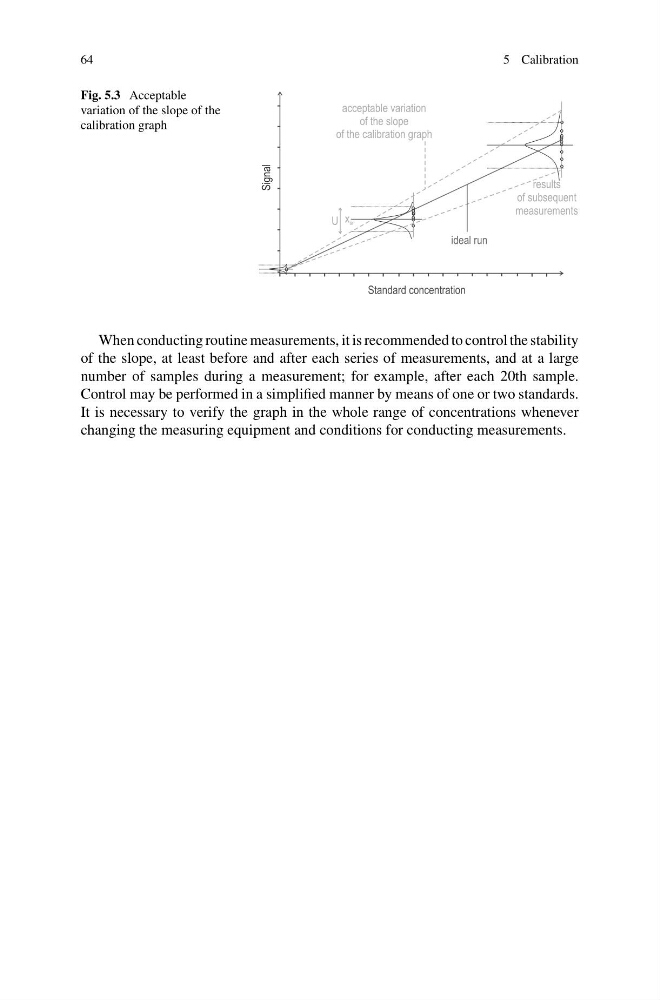
Fig. 5.3 Acceptable
variation of the slope of the
calibration graph
ideal run
acceptable variation
of the slope
of the calibration graph
U x śr
results
of subsequent
measurements
When conducting routine measurements, it is recommended to control the stability
of the slope, at least before and after each series of measurements, and at a large
number of samples during a measurement; for example, after each 20th sample.
Control may be performed in a simplified manner by means of one or two standards.
It is necessary to verify the graph in the whole range of concentrations whenever
changing the measuring equipment and conditions for conducting measurements.
5 Calibration
Fig. 5.3 Acceptable
variation of the slope of the
calibration graph
ideal run
acceptable variation
of the slope
of the calibration graph
U x śr
results
of subsequent
measurements
When conducting routine measurements, it is recommended to control the stability
of the slope, at least before and after each series of measurements, and at a large
number of samples during a measurement; for example, after each 20th sample.
Control may be performed in a simplified manner by means of one or two standards.
It is necessary to verify the graph in the whole range of concentrations whenever
changing the measuring equipment and conditions for conducting measurements.