

9.11 How to Evaluate Control Charts
169
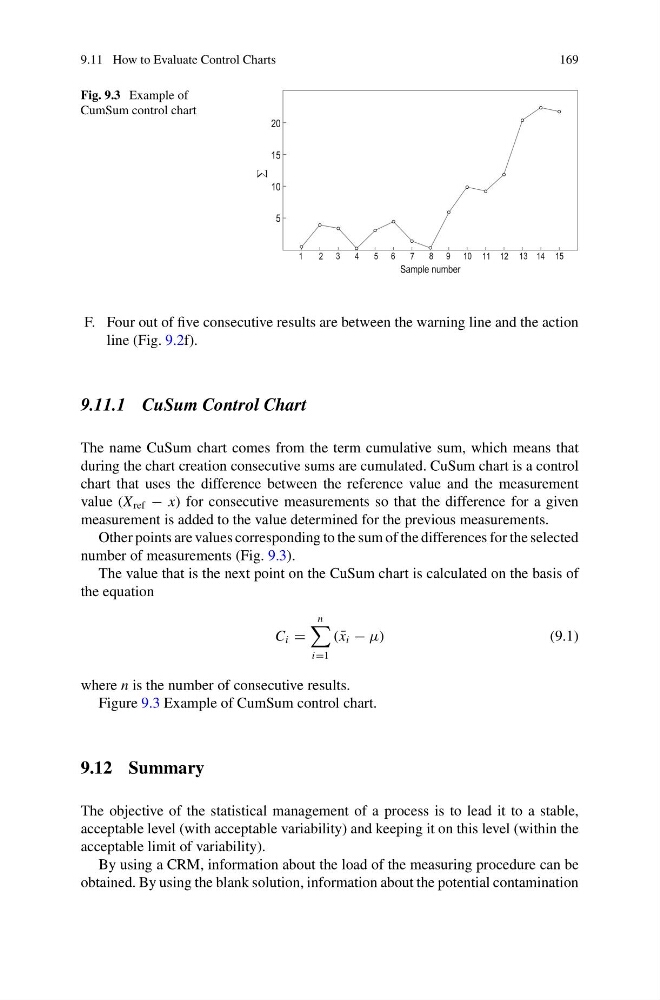
Fig. 9.3 Example of
CumSum control chart
Sample number
5
10
15
20
1
2 3
4
5 6
7
8 9 10 11 12 13 14 15
F. Four out of five consecutive results are between the warning line and the action
line (Fig. 9.2f).
9.11.1 CuSum Control Chart
The name CuSum chart comes from the term cumulative sum, which means that
during the chart creation consecutive sums are cumulated. CuSum chart is a control
chart that uses the difference between the reference value and the measurement
value (X ref − x) for consecutive measurements so that the difference for a given
measurement is added to the value determined for the previous measurements.
Other points are values corresponding to the sum of the differences for the selected
number of measurements (Fig. 9.3).
The value that is the next point on the CuSum chart is calculated on the basis of
the equation
C i
n
i1
( ¯
x i − µ)
(9.1)
where n is the number of consecutive results.
Figure 9.3 Example of CumSum control chart.
9.12 Summary
The objective of the statistical management of a process is to lead it to a stable,
acceptable level (with acceptable variability) and keeping it on this level (within the
acceptable limit of variability).
By using a CRM, information about the load of the measuring procedure can be
obtained. By using the blank solution, information about the potential contamination
169
Fig. 9.3 Example of
CumSum control chart
Sample number
5
10
15
20
1
2 3
4
5 6
7
8 9 10 11 12 13 14 15
F. Four out of five consecutive results are between the warning line and the action
line (Fig. 9.2f).
9.11.1 CuSum Control Chart
The name CuSum chart comes from the term cumulative sum, which means that
during the chart creation consecutive sums are cumulated. CuSum chart is a control
chart that uses the difference between the reference value and the measurement
value (X ref − x) for consecutive measurements so that the difference for a given
measurement is added to the value determined for the previous measurements.
Other points are values corresponding to the sum of the differences for the selected
number of measurements (Fig. 9.3).
The value that is the next point on the CuSum chart is calculated on the basis of
the equation
C i
n
i1
( ¯
x i − µ)
(9.1)
where n is the number of consecutive results.
Figure 9.3 Example of CumSum control chart.
9.12 Summary
The objective of the statistical management of a process is to lead it to a stable,
acceptable level (with acceptable variability) and keeping it on this level (within the
acceptable limit of variability).
By using a CRM, information about the load of the measuring procedure can be
obtained. By using the blank solution, information about the potential contamination